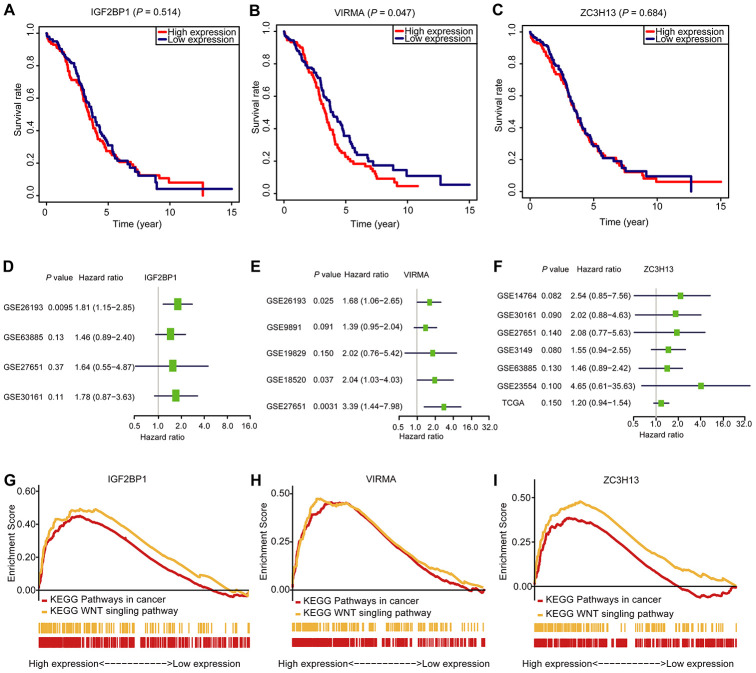
Figure 6.
The OS analysis, GSEA analysis, and validation in the GEO database of the three selected m6A RNA methylation regulators. (A–C) OS survival curve of OC patients based on the three selected m6A RNA methylation regulators levels. (D–F) The validation of the three selected m6A RNA methylation regulators using the GEO database through univariate analysis. (G–I) Enrichment of genes in the Kyoto Encyclopedia of Genes and Genomes (KEGG) different pathways by GSEA.

