Figure 2.

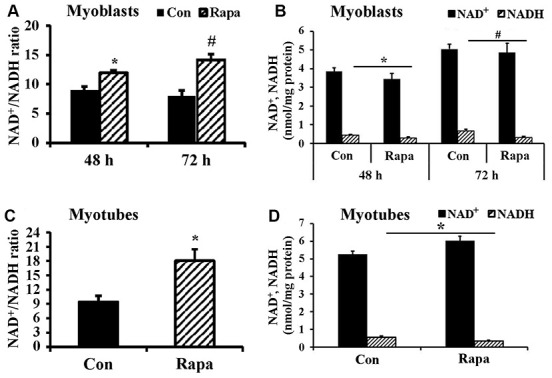
Effect of rapamycin on NAD+/NADH ratio of longer-term cultured C2C12 myoblasts and myotubes. (A) NAD+/NADH ratio of C2C12 myoblasts (2×10⁵ cells/well) cultured for 48 h and 72 h, then were treated by rapamycin (100 nM) for 24 h, respectively. *, P < 0.05 comparing control (cultured for 48 h followed by 24 h vehicle treatment) versus cells treated by rapamycin for 24 h group by Student’s t test. # P < 0.05 comparing control (cultured for 72 h followed by 24 h vehicle treatment) versus cells treated by rapamycin for 24 h group. (B) NAD+ and NADH concentration of C2C12 myoblasts. *, P < 0.05 control versus cells cultured for 48 h and then treated by rapamycin. #, P < 0.05 control versus cells cultured for 72 h and then treated by rapamycin. (C) NAD+/NADH ratio of C2C12 myotubes treated by rapamycin (100 nM) for 24 h. *, P < 0.05 control versus rapamycin-treated groups. (D) NAD+ and NADH concentrations of C2C12 myotubes treated by rapamycin (100 nM) for 24 h. *, P < 0.05 versus rapamycin-treated groups.
