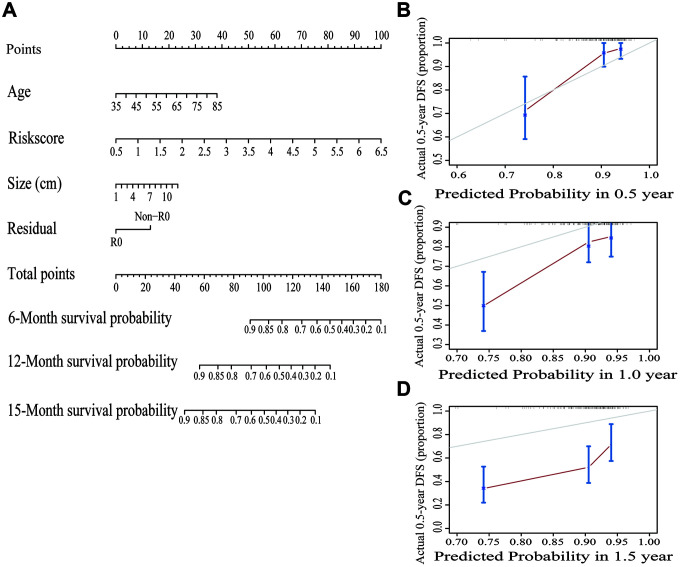
Figure 7.
Building and validating a predictive nomogram. (A) A nomogram to predict survival probability at 6, 12 and 15 months after surgery. (B) Calibration curve for the nomogram when predicting 6 months of overall survival. (C) Calibration curve for the nomogram when predicting 12 months of overall survival. (D) Calibration curve for the nomogram when predicting 15 months of overall survival.

