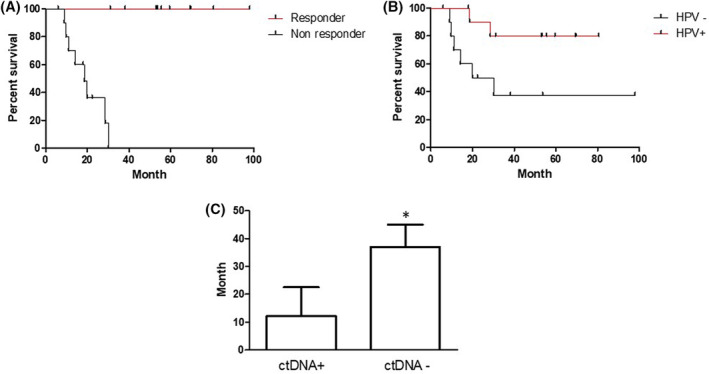
FIGURE 3.

A, Kaplan‐Meier curves illustrating overall survival outcomes by response status for head and neck oropharyngeal squamous cell carcinoma (OPSCC) patients. Log‐rank (Mantel‐Cox) test, P < .0001. B. Kaplan‐Meier curves illustrating overall survival outcomes by human papillomavirus (HPV) status for OPSCC patients. Log‐rank (Mantel‐Cox) test, P < .05. C, Disease‐free survival by cell‐free DNA (cfDNA) detection. *P value = .0668 for one‐sided T test
