Fig. 9.
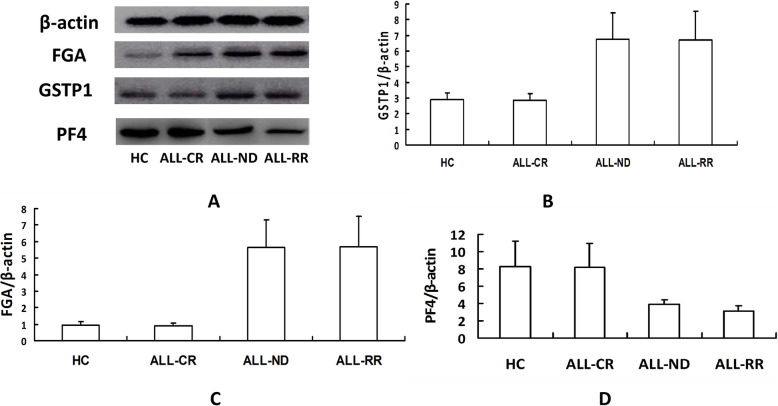
Validation of proteins by immunoblotting. a Levels of the FGA and GSTP1 protein differ among the leukemia cells in distinct ALL groups and normal cells. Weak PF4 immunoreactive bands are seen in newly diagnosed and refractory & relapsed ALL cases. b Densitometry comparison of FGA protein relative to β-actin as determined by western blot analysis in figure a. c Densitometry comparison of GSTP1 protein relative to β-actin as determined by western blot analysis in figure a. d Densitometry comparison of PF4 protein relative to β-actin as determined by western blot analysis in figure a. (FGA: fibrinogen alpha chain; GSTP1: glutathione S-transferase P1; PF4: platelet factor 4; ALL- CR: ALL complete remission; ALL-ND: ALL newly diagnosed; ALL-RR: ALL refractory & relapsed)

