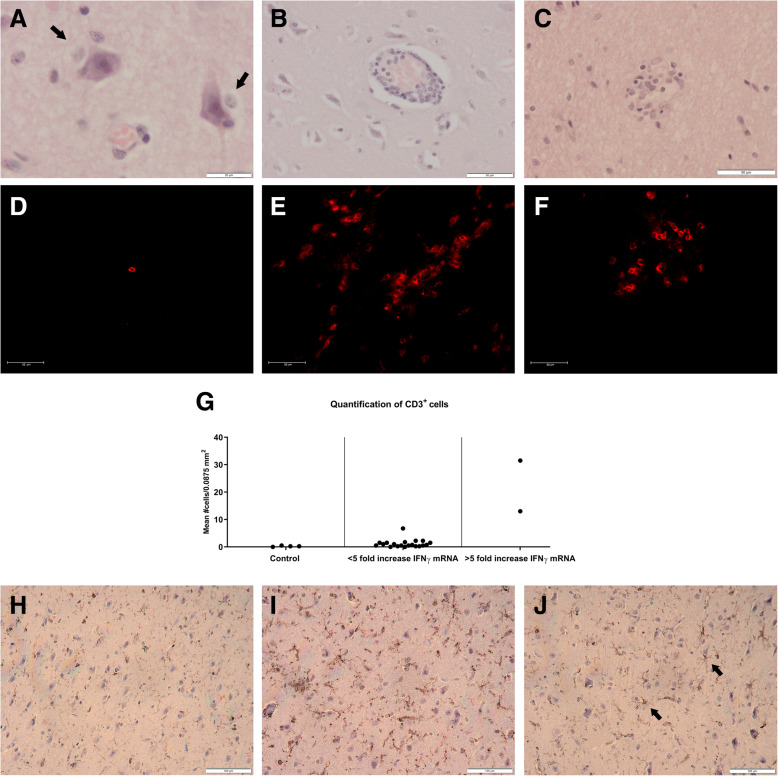
Fig. 4.
Histopathology, lymphocyte infiltration, and microglial activation in the cerebrum. Representative histopathologic lesions like perineuronal cuffing (a), perivascular cuffing (b), and noduli of microglial cells (c) observed in the cerebrum of animals B16 and B17 are shown. Representative pictures of infiltrating CD3+ T cells as visualized in the cerebrum of animals D2 (d), B15 (e), and B16 (f) are shown. Quantification of the number of CD3+ T cells in the cerebrum was done by counting their presence in 4 regions of 0.0875 mm2 under the fluorescence microscope of control pigs (D1, D2, D3, D8), pigs with a less than 5-fold increase in IFNy mRNA expression (A2, A3, A11, A13, A14, A15, A16, A17, A18, A22, A23, B2, B3, B11, B13, B14, B17, B22 B23), and pigs with more than 5-fold increase in IFNy expression (B15, B16). Each dot represents the mean of one animal (g). The activation status of microglial cells upon intradermal inoculation in the cerebrum was determined by quantification of IBA1 using the IHC profiler in ImageJ. Control pig D2 (h) shows a less intense IBA1 staining compared to pig B15 that showed an increased expression of pro-inflammatory cytokine mRNA (i). Even though scored as low positive, a more branched morphology of the microglial cells is seen in animal B16 as indicated by the arrows (j)

