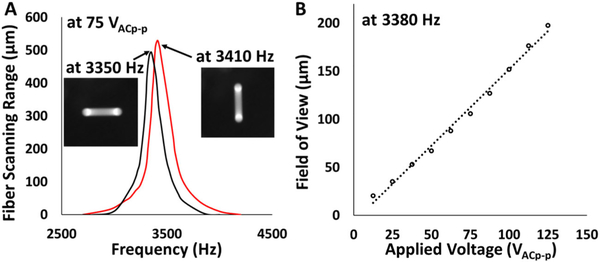
Fig. 2.
A, frequency responses of the resonant fiber-optic scanner, measured at a 75 VAC peak-to-peak drive voltage. The resonant frequencies were 3350 and 3410 Hz for the x and y scanning axis, respectively. The inset images show line scan patterns at each resonance. Precision assembling ensures mechanical symmetry of the PZT actuator and the fiber cantilever and minimizes the coupling forces. B, diameter of the endomicroscope imaging FOV with respect to the PZT drive voltages. An FOV greater than 150 μm in diameter can be achievedwitha100 VAC peak-to-peak drive voltage.

