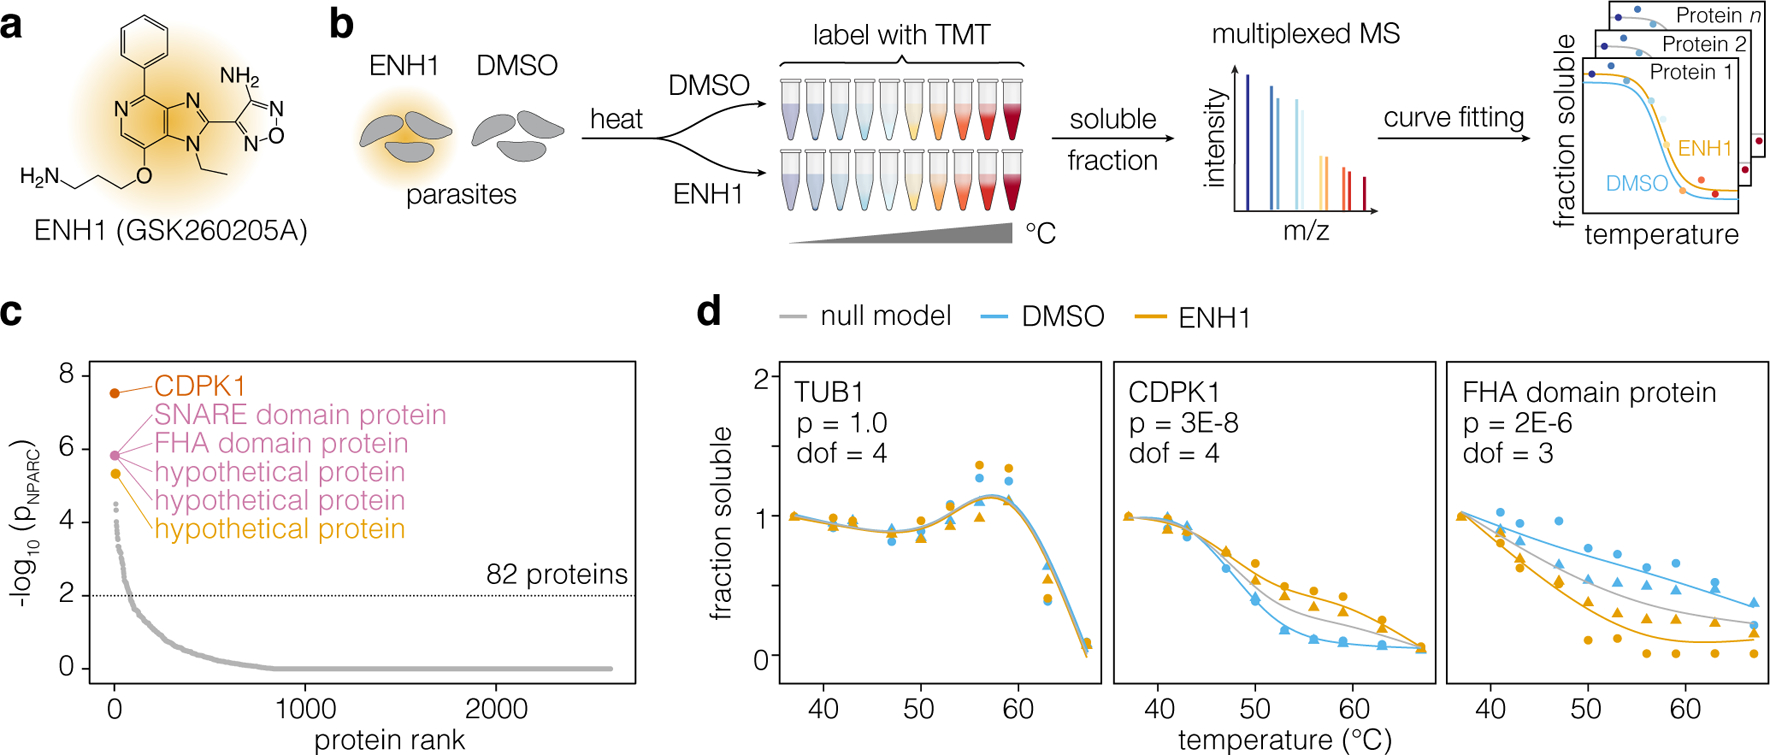
Figure 1. Thermal profiling identifies putative targets of ENH1.

(a) Structure of ENH1. (b) Thermal profiling strategy. Parasites (gray) treated with ENH1 or vehicle (DMSO) were heated, and soluble protein was extracted following lysis. Peptide abundance at each temperature was quantified by mass spectrometry to generate protein stability curves. (c) Proteins ranked by p-value, based on the responsiveness of their thermal profiles to ENH1. (d) Representative stability curves of proteins unaffected (TUB1: TGGT1_316400B), stabilized (CDPK1: TGGT1_301440), or destabilized (FHA domain-containing protein: TGGT1_267600) by ENH1. The p-value (p) corresponds to an F-statistic based nonparametric model comparing the shapes of protein stability curves corrected for multiple hypothesis testing; the degrees of freedom (dof) required for the curves is indicated. Circles and triangles denote replicates.
