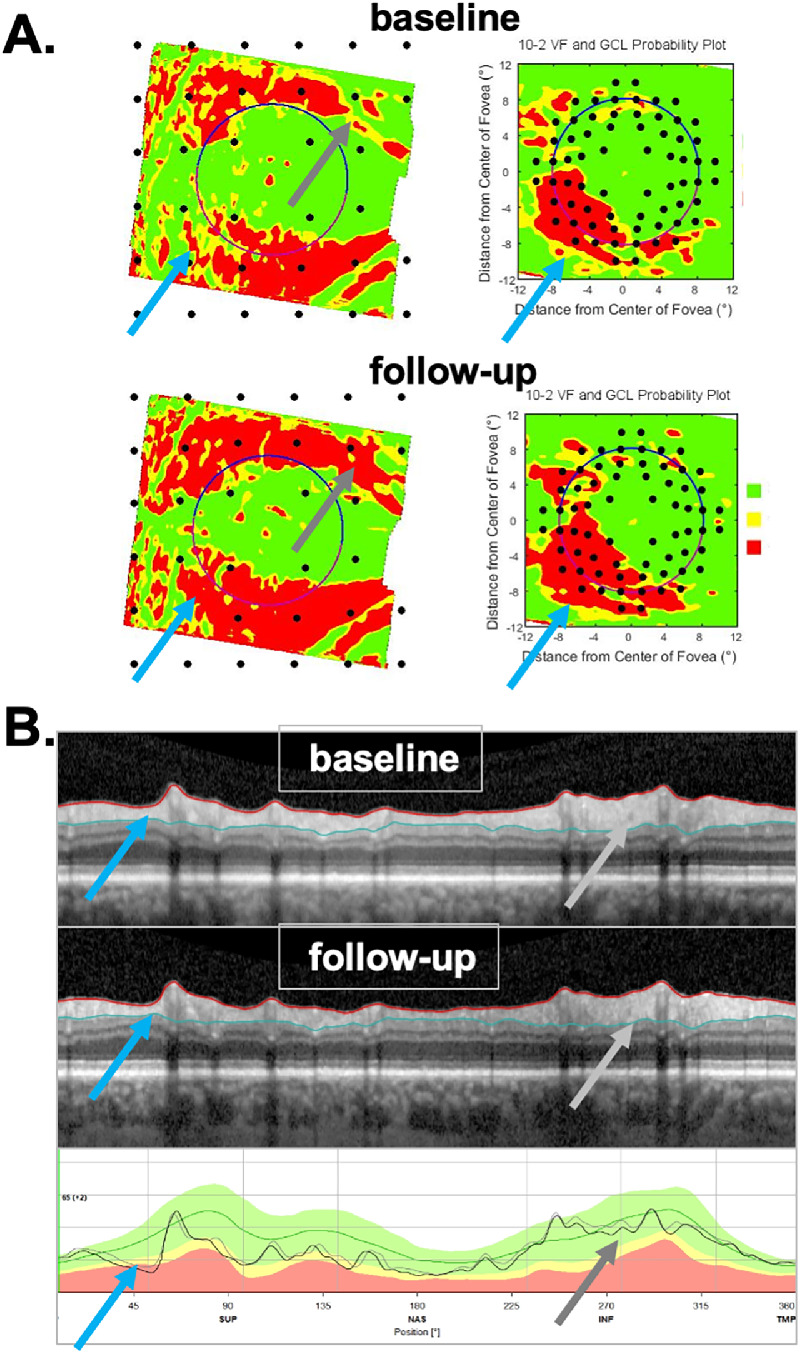
Figure 8.

Example of an eye (ID75) that was a TP as confirmed by the probability maps in (A) and reflected in the widespread progression seen on the b-scan and thickness map in (B). The arrows point to regions in (A) and (B) associated with the same defects in the superior retina/disc (light blue) and in the inferior retina/disc (gray).
