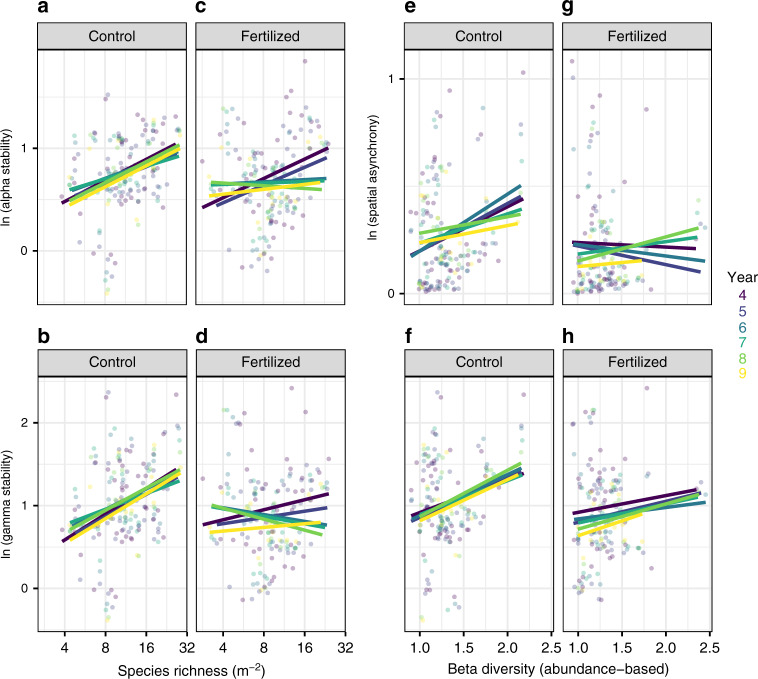
Fig. 2. Impact of fertilization on biodiversity–stability relationships across spatial scales.
Stability was measured as the temporal mean of primary productivity divided by its temporal standard deviation. Relationships were generally consistent among the periods of experimental duration considered (Supplementary Table 1). Species richness was positively associated with a alpha (slope and 95% CIs across time = 0.17 (0.08–0.26)) and b gamma stability (0.27 (0.15–0.39)) in the unmanipulated communities, but unrelated to c alpha (0.01 (−0.07 to 0.10)) and d gamma stability (−0.02 (−0.09 to 0.14)) in the fertilized communities. Beta diversity was positively related to e spatial asynchrony (0.18 (0.06–0.30)) and f gamma stability (0.47 (0.19–0.74)) in the unmanipulated communities, but unrelated to g spatial asynchrony (−0.01 (−0.13 to 0.12)) and h gamma stability (0.21 (−0.07 to 0.50)) in the fertilized communities. Note the scale of y-axis differ across panels and this needs to be considered when visually inspecting slopes. Each dot represents the collective subplots across the three replicated 1-m2 subplots for each site, treatment and duration period (n = 160). Colors represent the periods of experimental duration.

