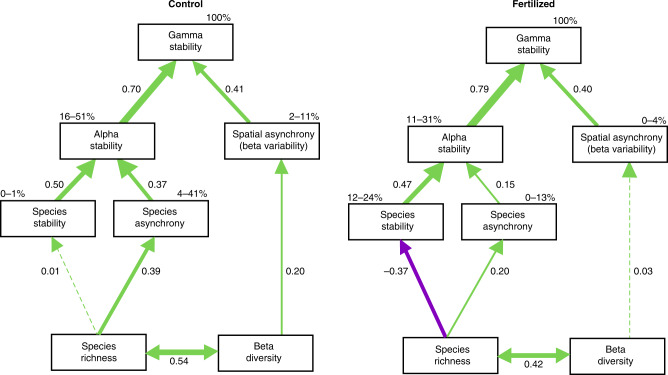
Fig. 3. Summary of meta-analysis results.
Direct and indirect pathways through which biodiversity, asynchrony, and stability at multiple spatial scales determines gamma stability under a unmanipulated control or b fertilized condition. Boxes represent measured variables and arrows represent relationships among variables. Numbers next to the arrows are averaged effect sizes as standardized path coefficients. Solid green and purple arrows represent significant (P ≤ 0.05) positive and negative coefficients, respectively, and dashed green and purple arrows represent nonsignificant coefficients. Widths of paths are scaled by standardized path coefficients. Percentages next to endogenous variables indicate the range of variance explained by the model (R2) across period of experimental duration.

