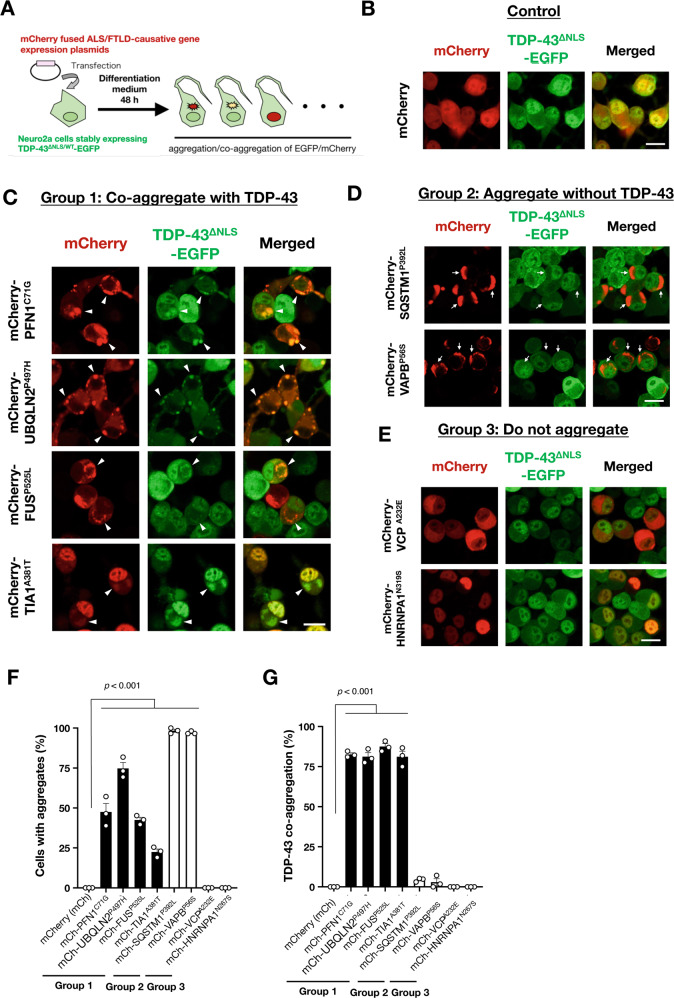
Fig. 1. TDP-43 co-aggregation screening using a familial ALS/FTLD causative gene expression library.
A Schematic illustration of the TDP-43 co-aggregation screening. B–E Representative images of the screening results with Neuro2a (N2a) cells with stably expressing EGFP-fused cytoplasmic TDP-43 mutants (TDP-43∆NLS-EGFP). The image expressing a control plasmid is shown in B. A total of 19 ALS/FTLD causative genes were classified into three groups: Group 1, genes that induce co-aggregates with TDP-43∆NLS (C); Group 2, genes that induce aggregates without TDP-43∆NLS (D); and Group 3, genes that do not form aggregates in the cells (E). The entire screening results are shown in Supplementary Fig. S1. Arrowheads in C indicate co-aggregates of the transfected proteins with TDP-43. Arrows in D indicate aggregates of the transfected proteins excluding TDP-43. Scale bars = 20 µm. F, G Quantification of N2a cells with aggregates of ALS/FTLD causative gene products (F) and the ratio of co-aggregation with TDP-43 (G). Data are expressed as mean ± standard error of the means (SEM) (n = 3). More than 50 cells were counted for the quantification.

