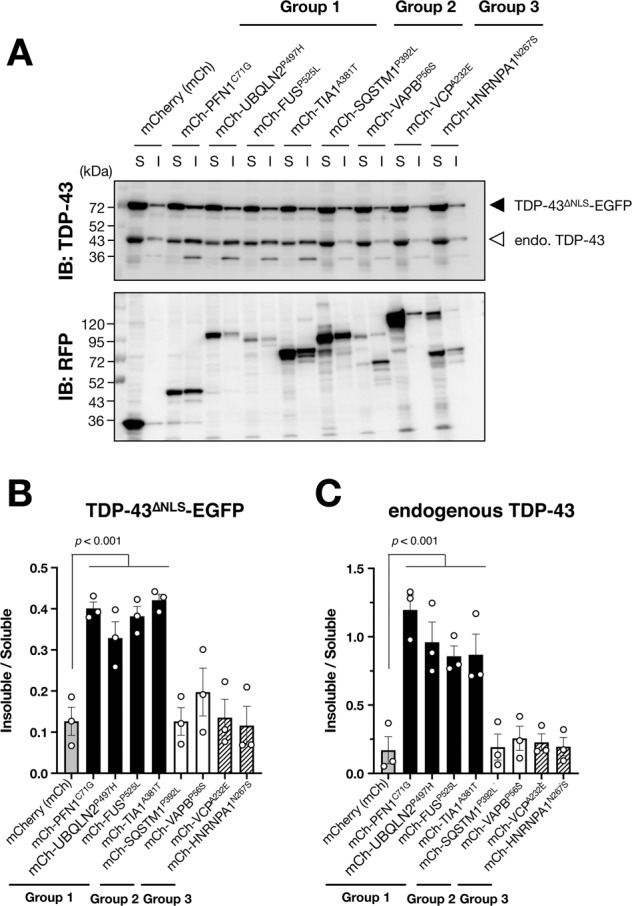
Fig. 3. RBPs and MRPs decrease solubility of TDP-43.

A Representative immunoblotting images showed the expressions of TDP-43 and mCherry (RFP) in soluble (S) or insoluble (I) fractions of N2a cells stably expressing TDP-43∆NLS-EGFP. B, C Quantification of insoluble TDP-43 normalized by soluble TDP-43. Data are shown as mean ± SEM (n = 3). Note that MRPs and RBPs, which are classified into Group 1, decreased solubility both of TDP-43∆NLS-EGFP (B) and endogenous TDP-43 (C) but the gene products classified into Group 2 or 3 did not.
