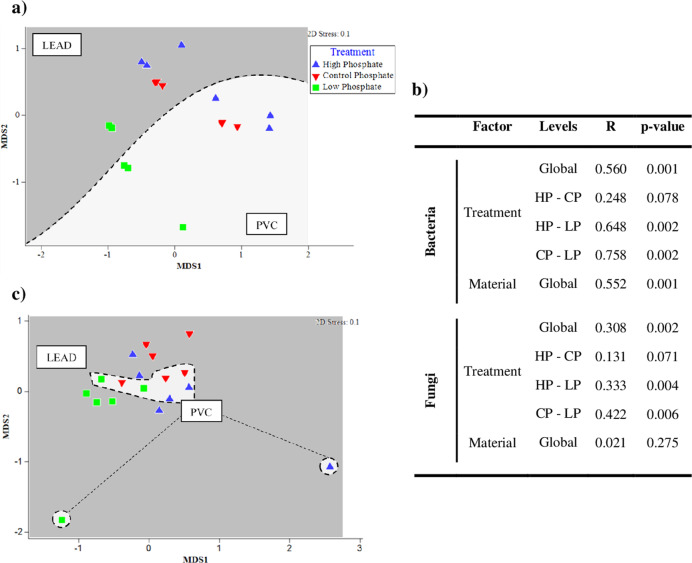
Fig. 6. Non-metric multidimensional scaling and ANOSIM analysis.
MDS plot based on the a bacterial and c fungal relative abundance of lead coupons and PVC tubing samples. The analysis was based on Bray–Curtis similarity matrix calculated from the relative abundance of bacteria OTUs at 97% cut off. The different groups are clustering according to the treatment used (high phosphate, control phosphate and low phosphate), a striped line separates both kind of materials (n = 18). b ANOSIM analysis. HP high phosphate, CP control phosphate, LP low phosphate.

