Figure 1.
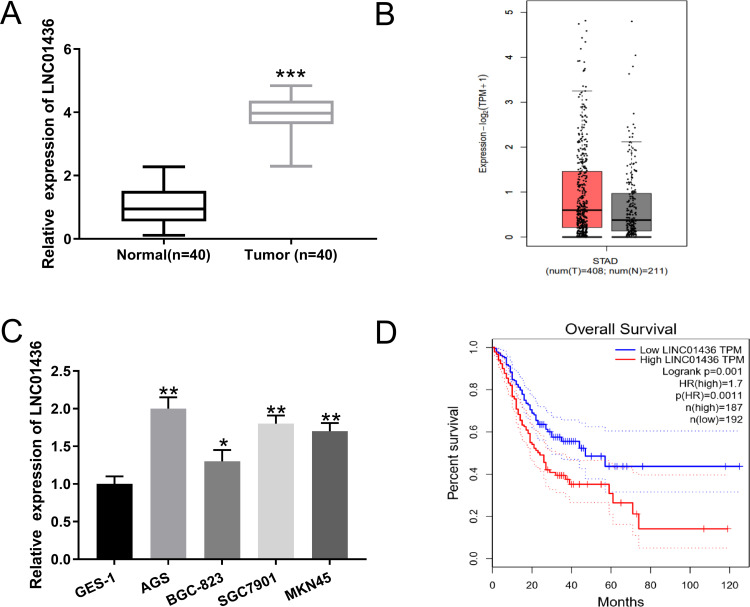
LINC01436 expression was up-regulated in GC. (A) qRT-PCR was used to detect the expression of LINC01436 in adjacent tissues and GC tissues. (B) The expression level of LINC01436 in GC tissues and gastric normal tissues was analyzed using TCGA data via GEPIA database. (C) qRT-PCR was used to detect the expression of LINC01436 in GES-1, AGS, BGC-823, SGC7901 and MKN45 cell lines. (D) Kaplan-Meier analysis was used to analyze the association between GC patients’ survival and LINC01436 expression using GEPIA database. *,** and *** represent P < 0.05, P < 0.01 and P < 0.001, respectively.

