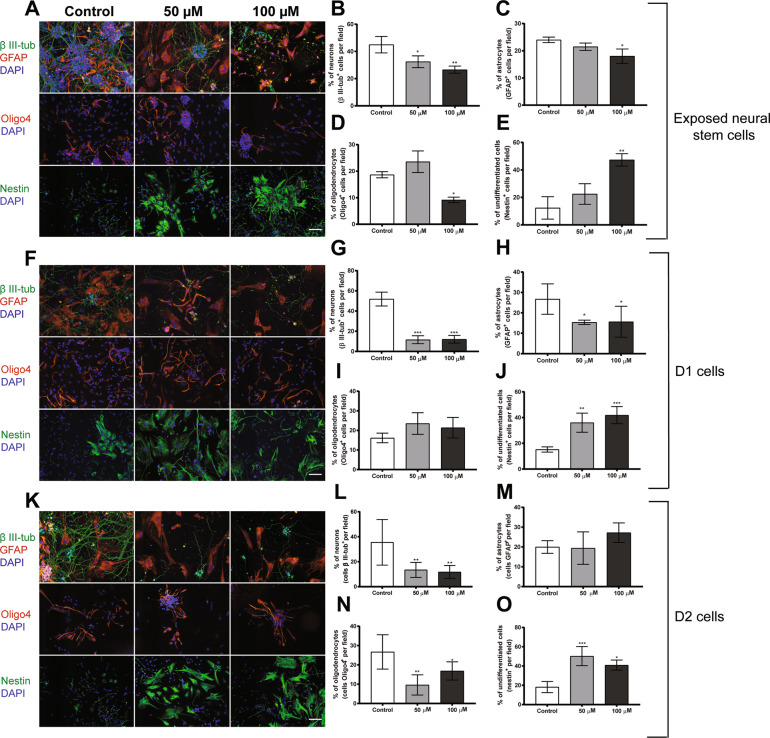
Fig. 4. BMAA exposure to 50 or 100 µM alters the differentiation of neural stem cells and their daughter cells (D1 and D2).
The cells were stained with the neuronal marker, β III-tubulin; astroglia marker, GFAP; the oligodendrocyte marker, Oligo4; and undifferentiated cells were marked with nestin. Nuclei were stained with DAPI. Representative images are shown (A, F, and K). Semiquantitative analyses of differentiated neurons (B, G, L), astrocytes (C, H, M), oligodendrocytes (D, I, N), and undifferentiated cells (E, J, O) were performed according to the material and methods section. Values represent mean ± SD from three independent experiments each with six replicates. Statistically significant differences from control are indicated as follows: *p < 0.05, **p < 0.01, and ***p < 0.001 (one-way ANOVA followed by the Tukey–Kramer test). Scale bar = 30 µm.

