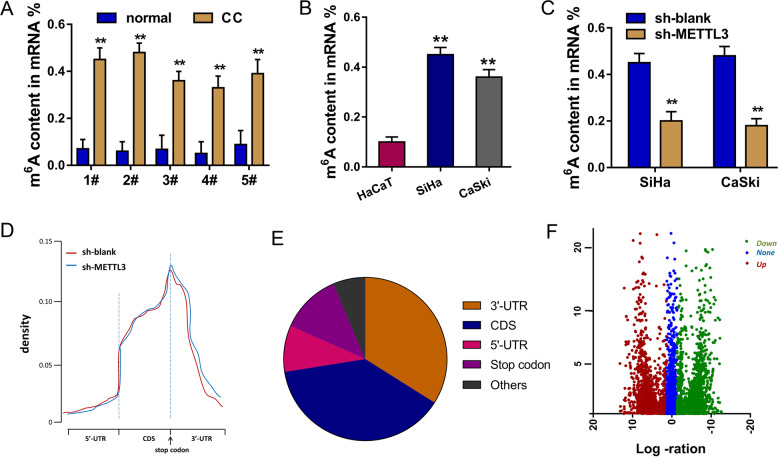
Fig. 1. METTL3 regulates the m6A level in CC tissue and cells.
a M6A quantitative analysis showed the percentage of m6A content in the CC tissue and adjacent normal tissue. b M6A quantitative analysis showed the percentage of m6A content in CC cells (SiHa, CaSki) and normal cells (HaCaT). c M6A quantitative analysis showed the percentage of m6A content in CC cells (SiHa, CaSki) transfected with METTL3 knockdown. d MeRIP-Seq analysis revealed the m6A peaks distributed at 3’-UTR, 5’-UTR and coding sequence (CDS). e Proportion analysis illustrated the m6A peaks were distributed in the 3’-UTR, CDS, 5’-UTR and stop codon. f Volcano plot of MeRIP-Seq showed the dysregulated m6A peaks in the CC cells. Data are displayed as mean ± standard deviation. **p < 0.01 vs. control.

