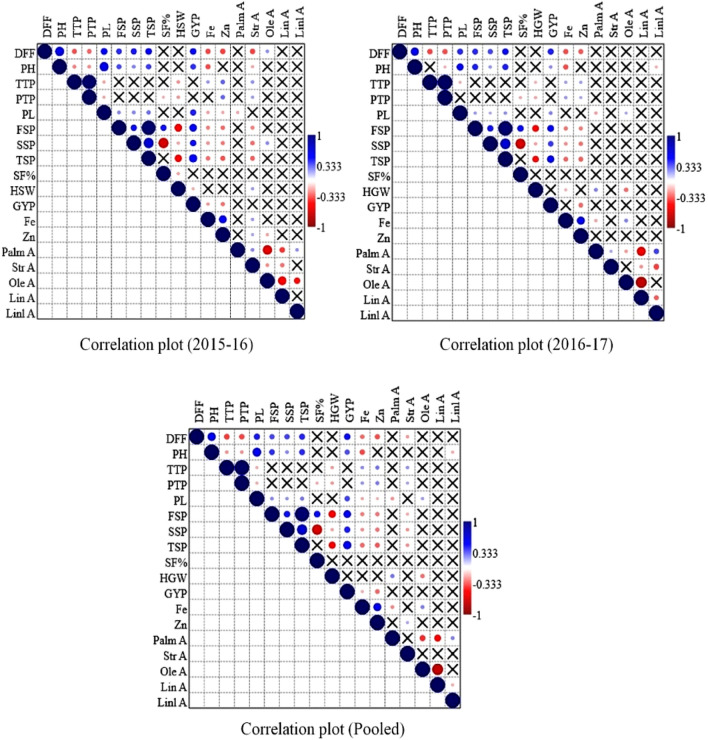
Fig. 1.
Correlations among the grain nutritional and yield related traits in rice landraces evaluated in two years along with pooled analysis. The blue colored circle shows the positive association, red colored circle indicates the negative association and the intensity of the color indicates degree of association (as explained in the right side of the each diagram). Cross sign shows no correlation between traits. The test of significance was calculated based on 0.05 probability level. DFF days to 50% flowering, PH plant height, TTP total tillers/plant, PTP productive tillers/plant, PL panicle length, FSP fertile spikelets/panicle, SSP sterile spikelets/panicle, TSP total spikelets/panicle, SF% spikelet fertility percent, HSW-100 seed weight, GY grain yield, Fe iron content, Zn zinc content, PA palmitic acid, SA stearic acid, OA oleic acid, LA linoleic acid and LnA linolenic acid

