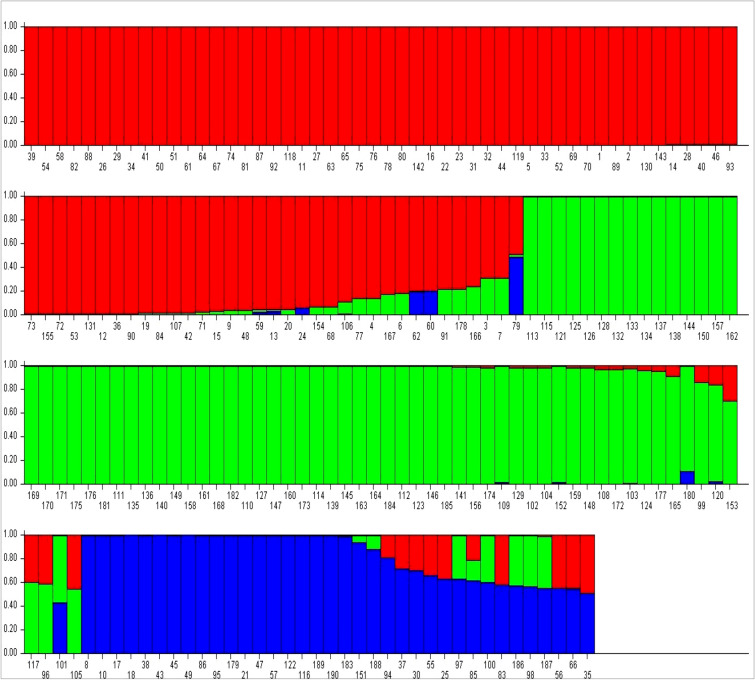
Fig. 2.
The bar plot presentation the genetic structure of 190 rice landraces based on population stratification at three sub-population level (K = 3). Red colored bar shows the genotypes of Sub Group-1, green colored bar shows the genotypes of Sub Group-2 and Blue colored bar shows the genotypes of Sub Group-3. Bars with mixed colored represent the mixed ancestry of genotypes (admixtures). X axis shows the serial number of genotypes and Y axis shows the membership proportion of genotype on respective sub-group

