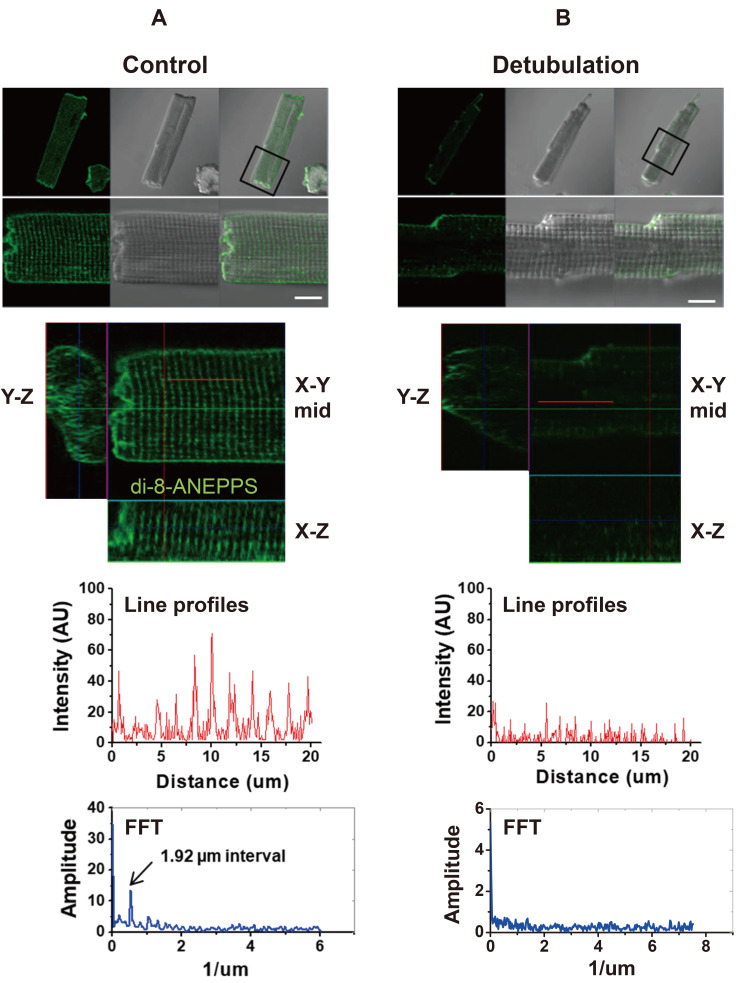
Fig. 2. Confocal imaging of the intracellular T-tubules of the ventricular myocyte.
(A) Normal control myocyte. (B) Detubulated ventricular myocyte. A plane of di-8-ANEPPS confocal image (green) is overlaid with an optical transmission image of the cell (scale bar, 10 µm). Representative X-Y, X-Z, and Y-Z confocal plane images are presented. Line profiles: The di-8-ANEPPS fluorescence intensity (arbitrary unit, AU) profile on the longitudinal direction (solid red line in the X-Y plane) shows regular striations of intracellular T-tubules. Fast Fourier transformation (FFT) of the fluorescence profile gives a peak of 1.92 µm intervals (n = 16). (B) Confocal images of a detubulated ventricular myocyte. The di-8-ANEPPS image overlaid with transmission image, representative X-Y, X-Z, and Y-Z confocal images, fluorescence intensity line profile, and FFT analysis are presented for detubulated myocyte. FFT of detubulated cell has no regular peaks (n = 11).

