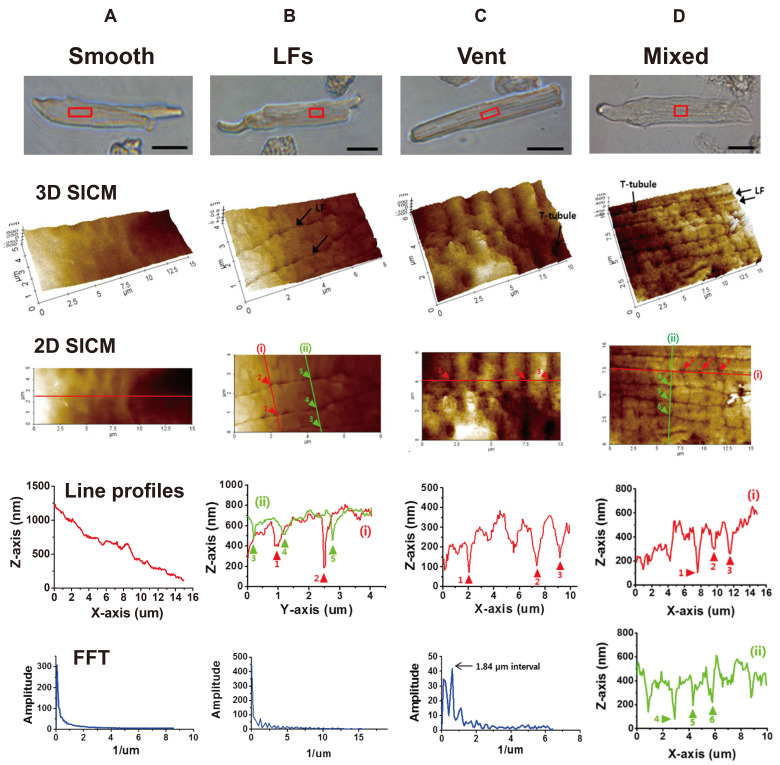
Fig. 3. Classification of rat atrial cell surface structure by scanning ion conductance microscopy (SICM) imaging.
The 3D SICM and 2D SICM images, topographic line profiles, and Fast Fourier transformation (FFT) analyses are presented for each subtype (A: smooth-type, B: longitudinal fissures (LFs)-type, C: ventricular-type, and D: mixed-type). Optical transmission images (scale bar, 20 µm) are presented with the SICM scanning area (red boxes). The lines presented on each 2D SICM images are used for the construction of topographic line profiles and FFT analysis. FFT was not performed for mixed-type. (A) SICM images and topography of the smooth-type have no particular pattern or regularity. (B) SICM images of the LFs-type show two parallel running LFs (arrows). The arrowheads indicate multiple T-tubule openings inside LFs. FFT analysis (lines i and ii) gives no regularity. (C) SICM images of the ventricular-type show the Z-grooves and the T-tubule openings (arrowheads). FFT shows the T-tubules are regularly opened at 1.84 µm intervals. (D) SICM images of the mixed-type show multiple LFs and T-tubule openings (arrowheads in line i and ii). The average intervals between T-tubule openings (i.e., intervals between arrowheads in longitudinal line i) were ~1.8 µm, though FFT has no regularity.

