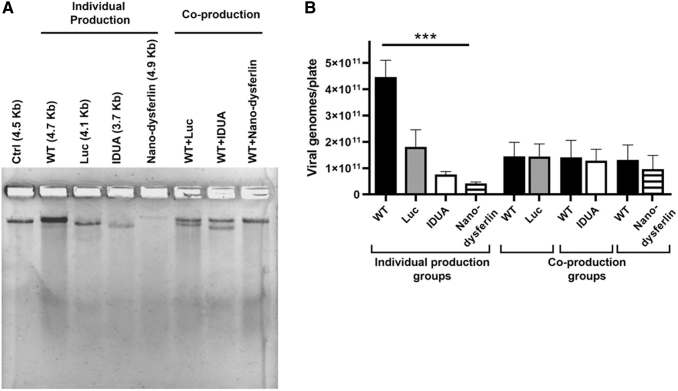
Figure 2.
AAV virion production following cotransfection of wt and rAAV plasmids. (A) Viral genome integrity and relative viral titer visualized by alkaline agarose gel electrophoresis. A reference vector was loaded at 5e10 vg (Ctrl). (B) Virus titer determined by probe-based qPCR presented as the total vg/plate (mean ± SD). ***p < 0.001 (p = 0.0006), Kruskal–Wallis test. qPCR, quantitative PCR.

