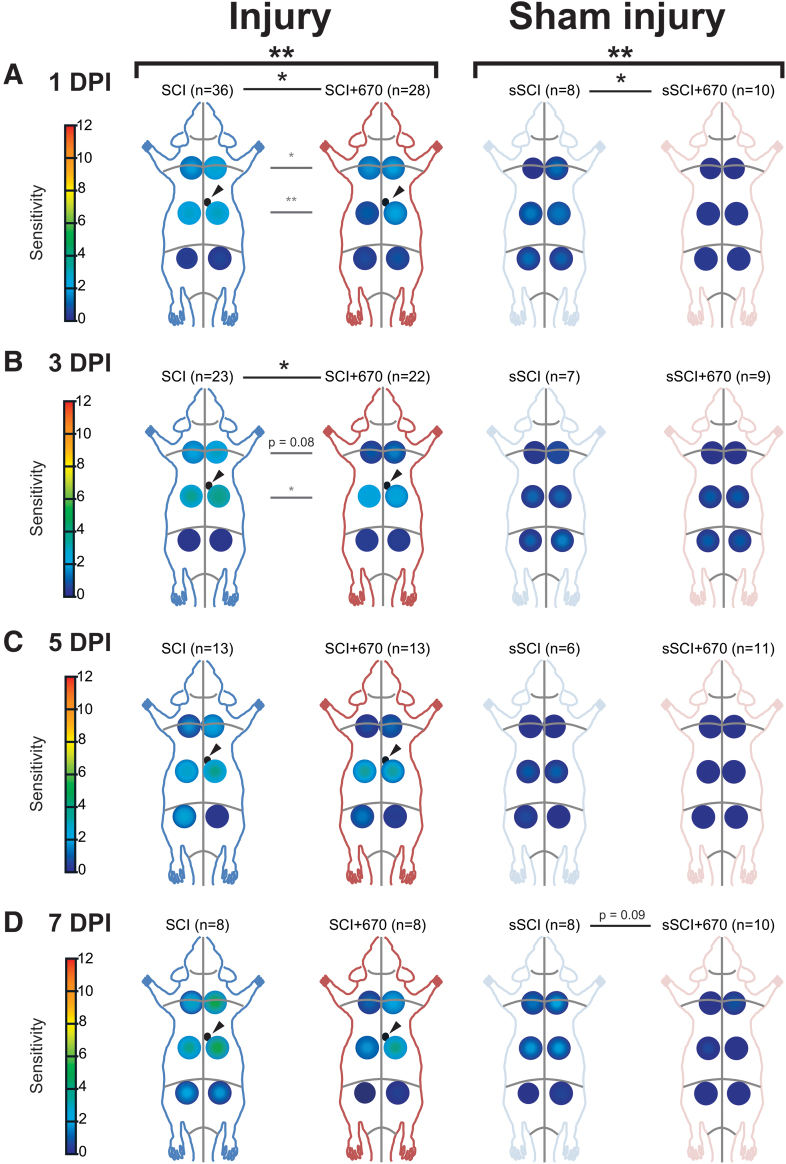
FIG. 2.
At-Level and Above-Level regional sensitivity are reduced by red-light treatment. RSSs in SCI (blue), SCI+670 (red), sSCI (light blue), and sSCI+670 (pink) animals at (A) 1 dpi, (B) 3 dpi, (C) 5 dpi, and (D) 7 dpi are shown for all animals investigated. Arrowheads indicate location of T10 hemi-contusion injury (small black circles) in SCI groups. Statistical comparisons between two groups across all time-points (black bracket, CLMM), across all levels at individual time-points (black lines, CLMM), and between two groups at different levels (gray lines, CLMM) are indicated. Data are expressed as mean ± SEM as per Figure 1A inset; n values indicated for each group; *p < 0.05, **p < 0.01, p-value indicated for 0.1 < p < 0.05. CLMM, cumulative link mixed model; dpi, days post-injury; RSS, regional sensitivity score; SCI, spinal-cord injured untreated; SCI+670, spinal-cord injured + red-light treatment; sSCI, sham-injured untreated; sSCI+670, sham-injured + red-light treatment; SEM, standard error of the mean. Color image is available online.

