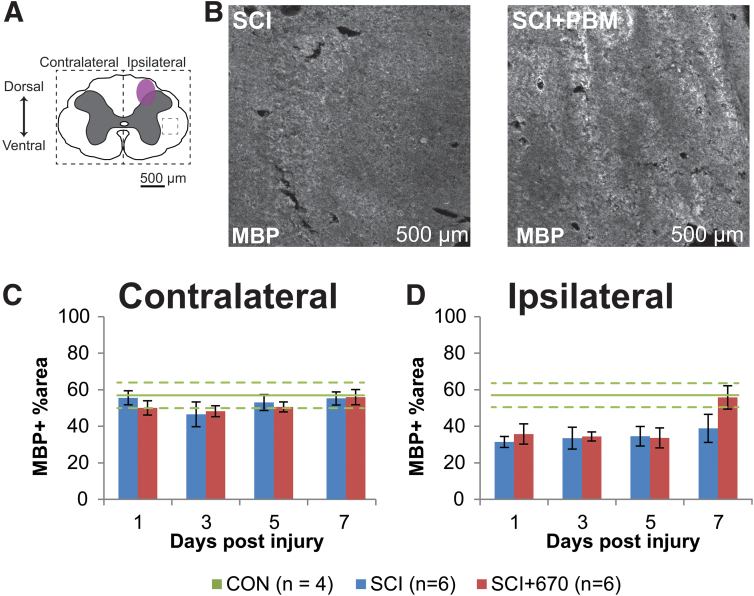
FIG. 3.
Ipsilateral demyelination was observed from 1–5 dpi post hemi-contusion SCI. (A) Schematic representation of the spinal cord illustrates the approximate location of the injury epicenter (purple shaded area) and region of interest (dotted) for MBP labeling quantification. (B) Example images are shown of positive MBP labeling (white) from sham- and light-treated groups ipsilateral to the injury at the dorsal level at 7 dpi (region of example images indicated by small dashed box in A). (C,D) Quantification of MBP-positive labeling, expressed as the percentage area of positive label above background within the region of interest (dotted boundaries in A), contralateral (C), and ipsilateral (D) to the injury of sham- and light-treated groups. Data for control animals are shown (solid green, mean; dotted green, SEM. All other data expressed as mean ± SEM; n values indicated (legend) are for each time-point. dpi, days post-injury; MBP, myelin basic protein; SCI, spinal cord injury; SEM, standard error of the mean. Color image is available online.

