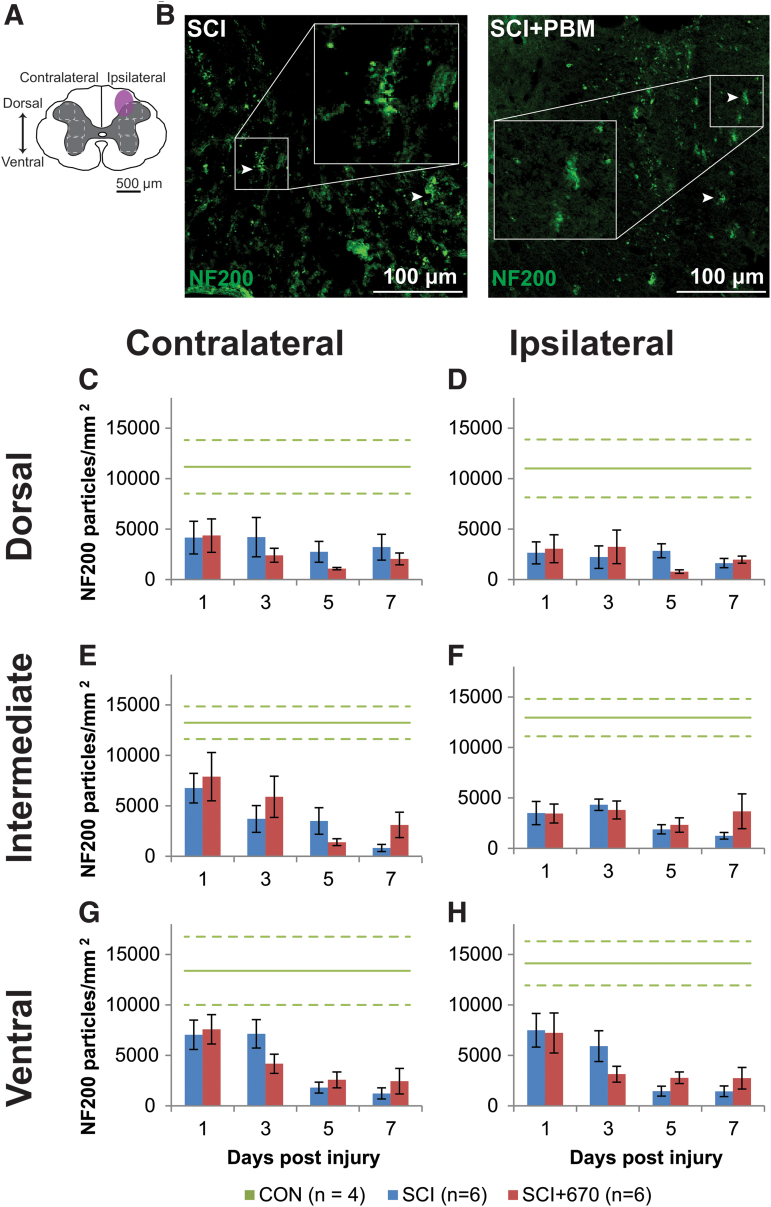
FIG.4. NF200 density is reduced following spinal cord injury but not altered by red-light treatment. (A) The schematic representation of the spinal cord illustrates the dorsal, intermediate, and ventral regions of interest for analysis (enclosed by dashed lines, 0.1 mm2). Approximate location of injury is indicated (purple shaded area). (B) Example images of NF200 (green) positive labeling from spinal-cord injured sham- and light-treated groups ipsilateral to the injury at dorsal level at 7 dpi. (C,D) Quantification of NF200+ labeling expressed as positive particle density within the region of interest, in the dorsal region of the spinal cord, contralateral (C) and ipsilateral (D) to the injury of sham- and light-treated groups. (E,F) NF200+ particle density in the intermediate regions of interest contralateral (E) and ipsilateral (F) to the injury. (G,H) NF200+ particle density in the ventral regions of interest contralateral (G) and ipsilateral (H) to the injury. Data for control animals are shown (solid green, mean; dotted green, SEM). All other data expressed as mean ± SEM; n values indicated for each time-point (legend). See text for statistical comparisons. dpi, days post-injury; SCI, spinal-cord injured animals without red-light treatment; SCI+670, spinal-cord injured animals with red-light treatment; SEM, standard error of the mean. Color image is available online.

An official website of the United States government
Here's how you know
Official websites use .gov
A
.gov website belongs to an official
government organization in the United States.
Secure .gov websites use HTTPS
A lock (
) or https:// means you've safely
connected to the .gov website. Share sensitive
information only on official, secure websites.
