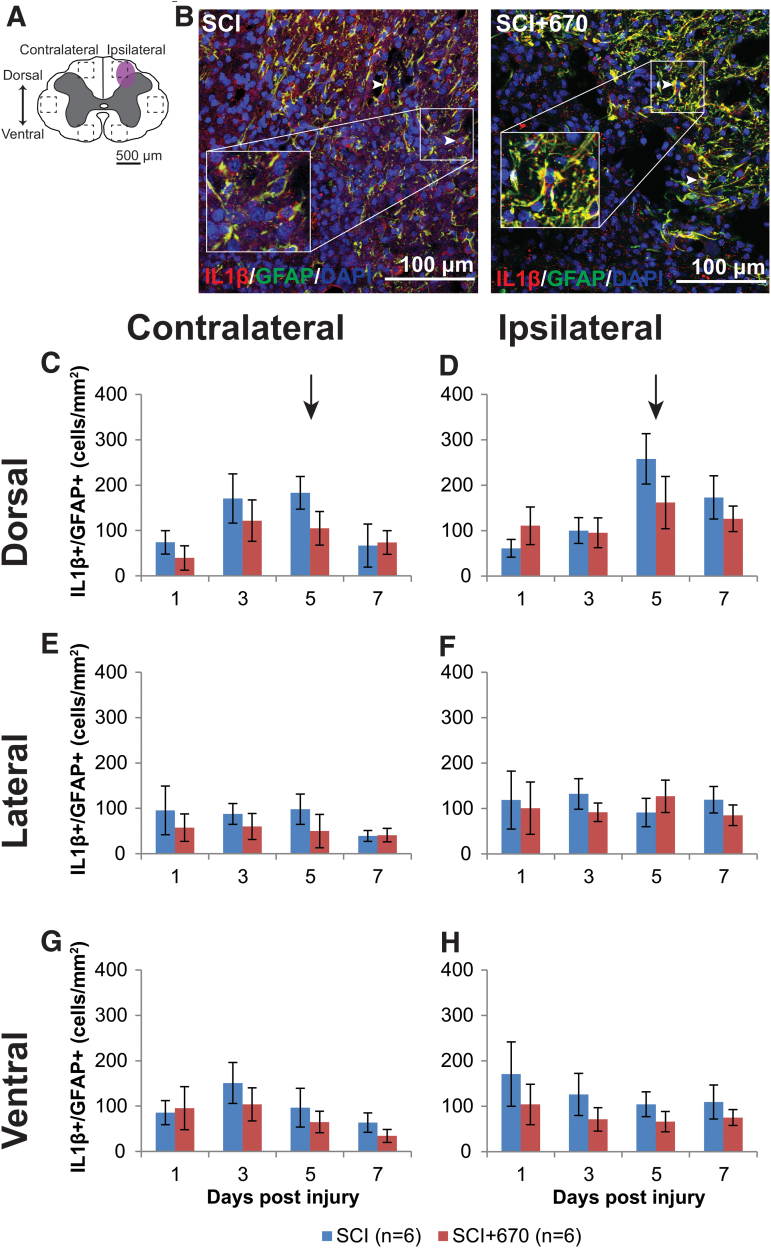
FIG. 7.
The density of IL-1β producing astrocytes is not affected by red-light treatment following mild T10 hemi-contusion. (A) The schematic representation of the spinal cord illustrates the dorsal, lateral, and ventral regions of interest for analysis (enclosed by dashed lines, area of each box: 0.1 mm2). Approximate location of injury is indicated by the purple shaded area. (B) Example images of IL-1β (red), GFAP (green), and DAPI (blue) triple-positive cells from spinal-cord injured untreated and light-treated groups ipsilateral to the injury at dorsal region at 7 dpi. (C,D) Quantification of IL-1β+GFAP+DAPI+ cells, expressed as triple-positive cell density within the region of interest, in the dorsal region of the spinal cord, contralateral (C) and ipsilateral (D) to the spinal cord injury of untreated and light-treated groups. (E,F) IL-1β+GFAP+DAPI+ cell density in the lateral regions of interest contralateral (E) and ipsilateral (F) to the injury. (G,H) IL-1β+GFAP+DAPI+ cell density in the ventral regions of interest contralateral (G) and ipsilateral (H) to the injury. For each time-point n values are indicated (legend). Arrows indicate the 5-dpi time-point is significantly increased in the dorsal region compared with lateral and ventral regions (p = 0.0003, LMER, Tukey). Data are expressed as mean ± SEM. dpi, day post-injury; GFAP, glial fibrillary acidic protein; IL-1β, interleukin 1 beta; LMER, linear mixed-effects models; SCI, spinal-cord injured animals without red-light treatment; SCI+670, spinal-cord injured animals with red-light treatment; SEM, standard error of the mean. Color image is available online.

