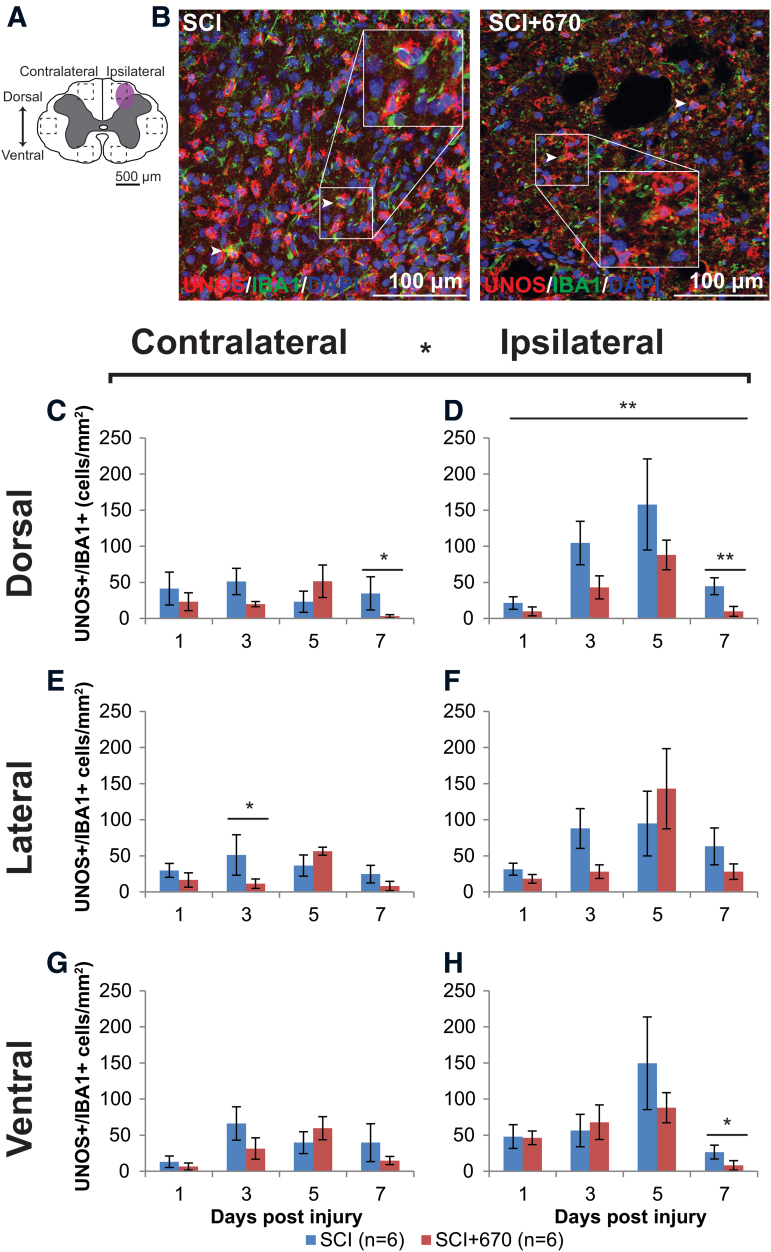
FIG. 9.
iNOS expressing microglia/macrophage immunoreactivity is reduced by red-light treatment following T10 hemi-contusion. (A) The schematic representation of the spinal cord illustrates the dorsal, lateral, and ventral regions of interest for analysis (enclosed by dashed lines, area of each box: 0.1 mm2). Approximate location of injury is indicated by the purple shaded area. (B) Example images are shown of uNOS (red), IBA1 (green), and DAPI (blue) triple-positive cells from spinal-cord injured untreated and light-treated animals at the dorsal region, ipsilateral to the injury at 7 dpi. (C,D) Quantification of uNOS+IBA1+DAPI+ cells, expressed as triple-positive cell density within the dorsal region of interest, is shown contralateral (C) and ipsilateral (D) to the injury of untreated and light-treated groups. (E,F) uNOS+IBA1+DAPI+ cell density in the lateral regions of interest contralateral (E) and ipsilateral (F) to the injury. (G,H) uNOS+IBA1+DAPI+ cell density in the ventral regions of interest contralateral (G) and ipsilateral (H) to the injury. For each time-point n values are indicated (legend). Data are expressed as mean ± SEM; *p < 0.05, **p < 0.01, LMER. dpi, day post-injury; IL-1β, interleukin 1 beta; iNOS, inducible nitric oxide synthase; LMER, linear mixed-effects models; SCI, spinal-cord injured animals without red-light treatment; SCI+670, spinal-cord injured animals with red-light treatment; SEM, standard error of the mean. Color image is available online.

