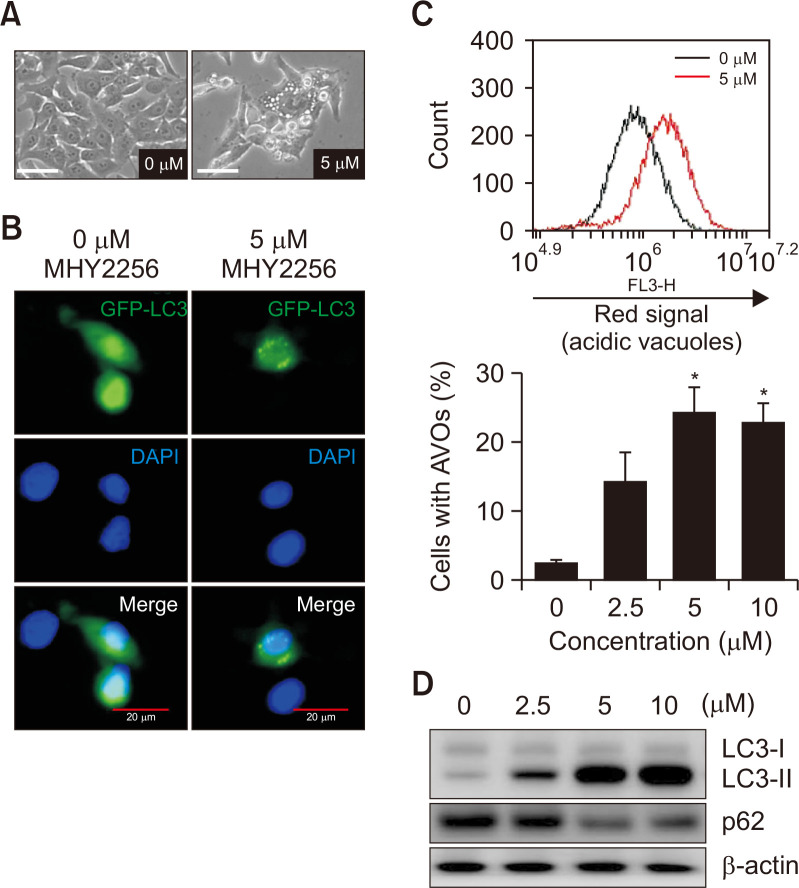
Fig. 7.
Effect of MHY2256 on the induction of autophagy in HCT116 cells. (A) Cells were treated with 5 µM MHY2256 for 24 h, and representative images were captured using phase contrast microscopy at a magnification of 400x. Scale bar, 20 µm. (B) HCT116 cells were transfected with the light-chain 3 (LC3)-green fluorescent protein (GFP) plasmid for 24 h, and transfected cells were treated with 5 µM MHY2256 for 24 h. The formation of GFP-LC3 puncta was examined using confocal microscopy. Representative data from three independent experiments are shown. Scale bar, 20 µm. (C) Cells were incubated with MHY2256 for 24 h, stained with acridine orange, and then analyzed using flow cytometry to quantify formation of acidic vesicular organelles (AVOs). The results are expressed as mean ± SD (n=3), *p<0.05 vs. vehicle-treated cells. (D) Cells were treated with the indicated concentrations of MHY2256 for 24 h, and expression levels of LC3 and p62 protein were monitored using western blot analysis.

