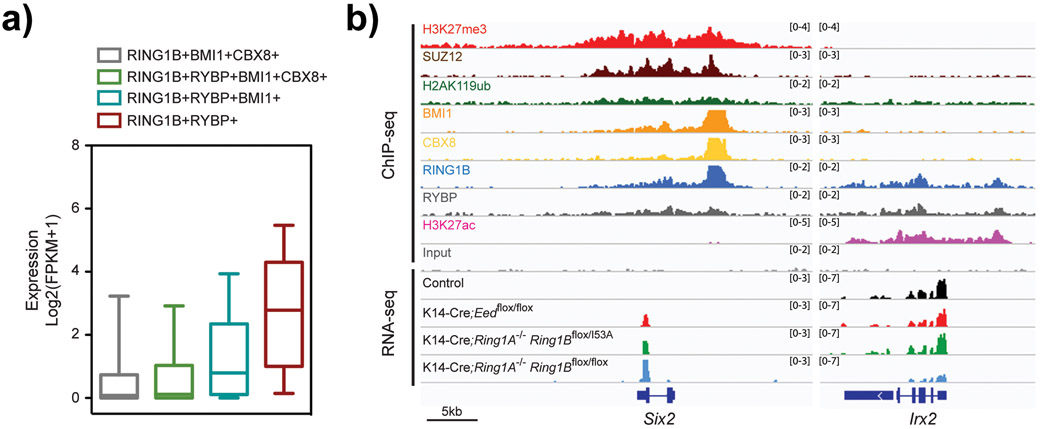
Fig. 3. ncPRC1 core subunits are bound to both silent and active genes.
(A) Expression analysis of genes located near the indicated PRC1 subunits in control epidermal progenitors. Note higher level of expression in genes bound by ncPRC1 subunits, compared with genes bound by cRPC1 subunits. Gene expression data is presented as FPKM values in box-and-whisker boxplots. Midline, median; box limits, 25th percentile (lower quartile) and 75th percentile (upper quartile); upper whisker, 75th-95th percentile; lower whisker, 5th-25th percentile. (B) Integrative Genomics Viewer (IGV) ChIP-seq and RNA-seq browser views for the indicated markers and genotypes in epidermal progenitors. Note that in active gene bound by ncPRC1 subunits, loss of PRC1-global activity results in downregulation of gene expression, whereas loss of PRC1-catalytic activity or PRC2 does not affect gene expression. Data was obtained from the Gene Expression Omnibus (GEO) database (GSE112460) and was analyzed as previously described.[21]

