Figure 1.

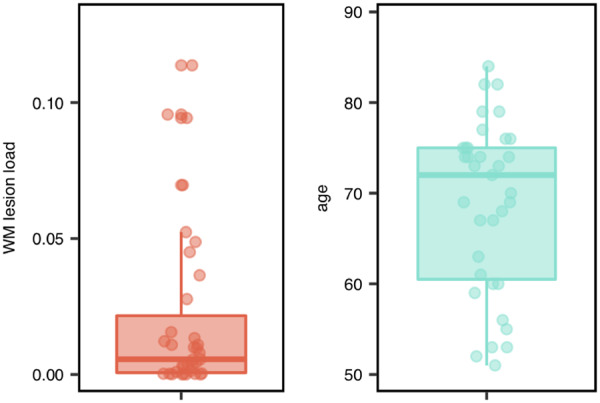
WMH lesion load and age of all participants. Left column depicts the WMH lesion load ratio. Right column depicts the age distribution. Boxplots depict median and 25%/75% quantile; points show individual data.

WMH lesion load and age of all participants. Left column depicts the WMH lesion load ratio. Right column depicts the age distribution. Boxplots depict median and 25%/75% quantile; points show individual data.