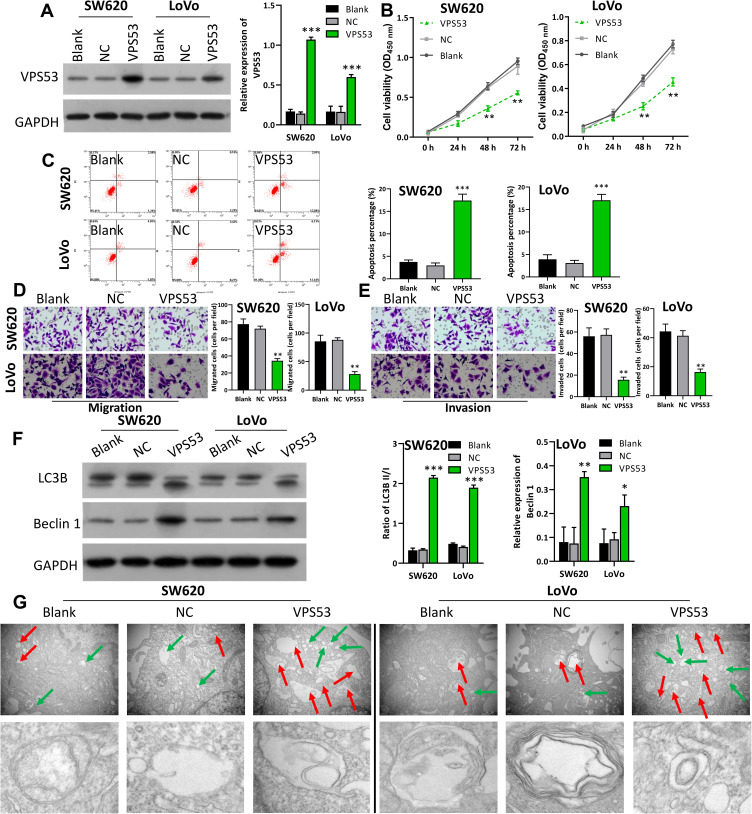
Figure 2.
Overexpression of VPS53 suppressed proliferation, migration, and invasion, and facilitated apoptosis and autophagy of CRC cells. SW620 and LoVo cells were transfected with the pcDNA-VPS53 plasmid and NC, respectively. (A) VPS53 expression was determined by Western blotting analysis and the VPS53 level was normalized to GAPDH, ***P < 0.001. (B) CCK-8 assay investigated the effects of VPS53 overexpression on SW620 and LoVo cells, **P < 0.01. (C) Apoptotic analysis of SW620 and LoVo cells was evaluated by flow cytometry, and then the percentage of apoptosis was calculated, ***P < 0.001. (D and E) Transwell assays were used, and the results show the number of migrated and invaded cells per field, magnification, ×200; **P < 0.01. (F) Western blotting analysis displays expressions of Beclin 1 and LC3B, and the ratio of LC3BII/I and Beclin 1 level were counted based on the grayscale, *P < 0.05, **P < 0.01, ***P < 0.001. (G) Electron microscopy shows the number of autophagosomes in each group. The red arrow denotes autophagosomes and the green arrow denotes the lysosomes.

