
Fig. 2.
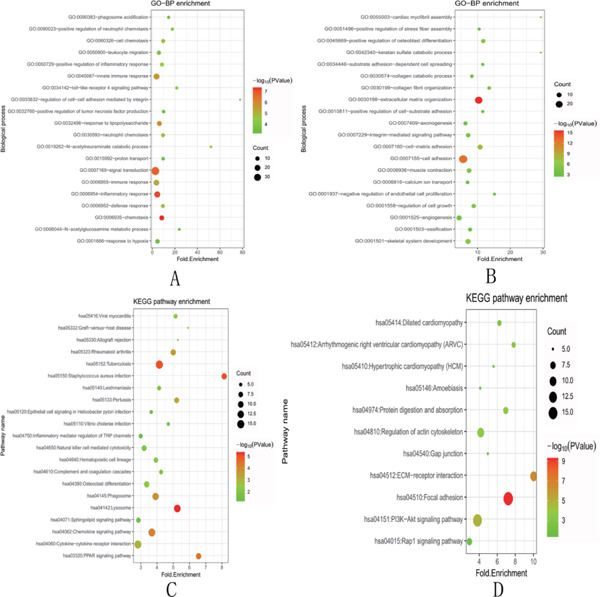
Bubble diagram (top) results of the functional enrichment analyses of upregulated and downregulated DEGs
The size of an individual point represents the degree of enrichment. The color depth represents the P-value. A. GO-BP enrichment analysis of upregulated DEGs. B. GO-BP enrichment analysis of downregulated DEGs. C. KEGG pathway enrichment analysis for upregulated genes. D. KEGG pathway enrichment analysis for downregulated genes. GO, gene ontology; KEGG, Kyoto Encyclopedia of Genes and Genomes; DEGs, differentially expressed genes