
Fig. 3.
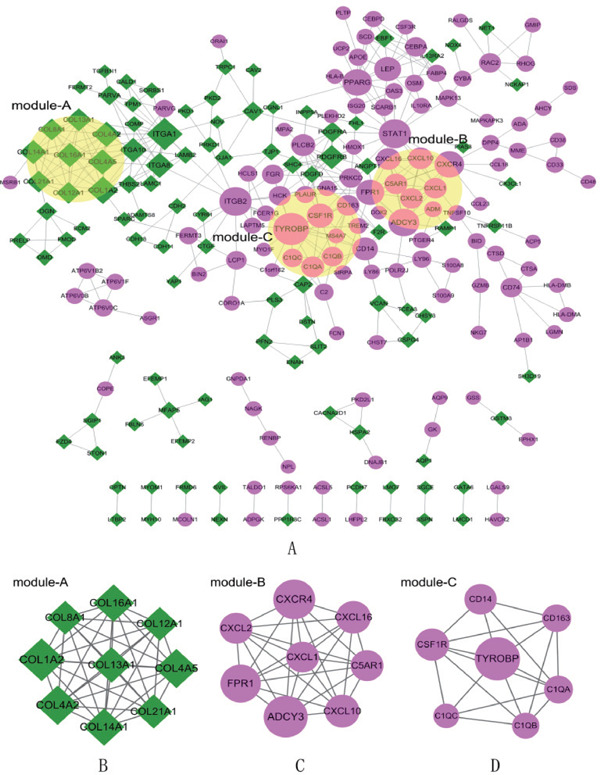
PPI network and subnet module analysis
The violet circles represent the upregulated DEGs, and the green diamonds represent the downregulated DEGs. The size of the nodes represents the number of protein-protein interaction pairs of a certain protein. The lines between two nodes represent the interaction of two proteins. A. Construction of PPI networks. B, C, D. Subnet module analysis of PPI. B, mcode 1; C, mcode 2; D, mcode 3. PPI, protein–protein interactions; DEGs, differentially expressed genes.