
Fig. 6.
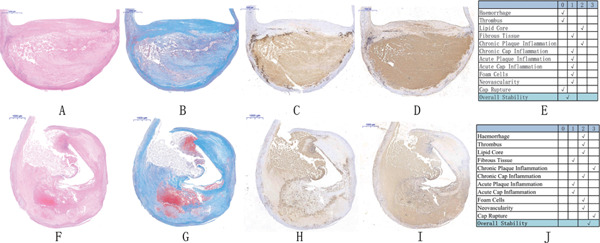
Representative histologic images of the stable and unstable plaques and the classification system
A–E: Representative image and stability scoring of the stable plaques. F–J: representative image and stability scoring of the unstable plaques. A, F indicate hematoxylin–eosin staining (scale bar: 1,000 µm); B, G indicate Masson's trichrome staining (scale bar: 1,000 µm); C, H indicate CD68 immunostaining; D, I indicate CD31 immunostaining (scale bar: 1,000 µm); E: associated scoring chart for the stable plaques; J: associated scoring chart for the unstable plaques.