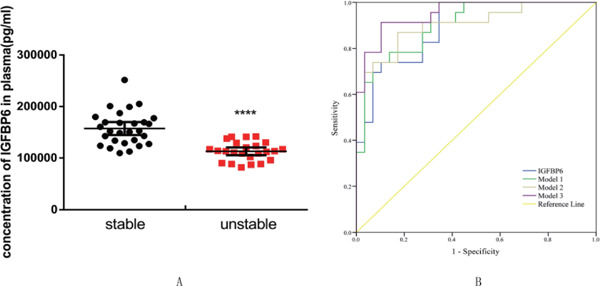
Fig. 9.

A. Concentration of IGFBP6 protein in the plasma of patients with histologically stable versus unstable plaque. (****p < .0001) B. ROC curves of IGFBP6, models 1, 2, and 3 for the discrimination between patients with stable and unstable plaques. The discriminative power of IGFBP6: the AUC was 0.894 (95% CI: 0.810–0.977), the sensitivity was 1.000, and the specificity was 0.655. The discriminative power of model 1: AUC was 0.903 (95% CI: 0.823–0.982), the sensitivity was 0.739, and the specificity was 0.931. The discriminative power of model 2: AUC was 0.906 (95% CI: 0.821–0.990), the sensitivity was 0.870, and the specificity was 0.828. The discriminative power of model 3: AUC was 0.952 (95% CI: 0.900–1.000), sensitivity was 0.913, and specificity was 0.897. Model 1, IGFBP6 adjusted for age and gender; model 2, age, gender, smoke, hypertension, weight, diabetes, creatinine, triglyceride, and total high-density lipoprotein and low-density lipoprotein cholesterol levels; model 3, IGFBP6 adjusted for all the above cofounders. ROC, receiver operating characteristic; AUC, area under the curve; CI, confidence interval.
