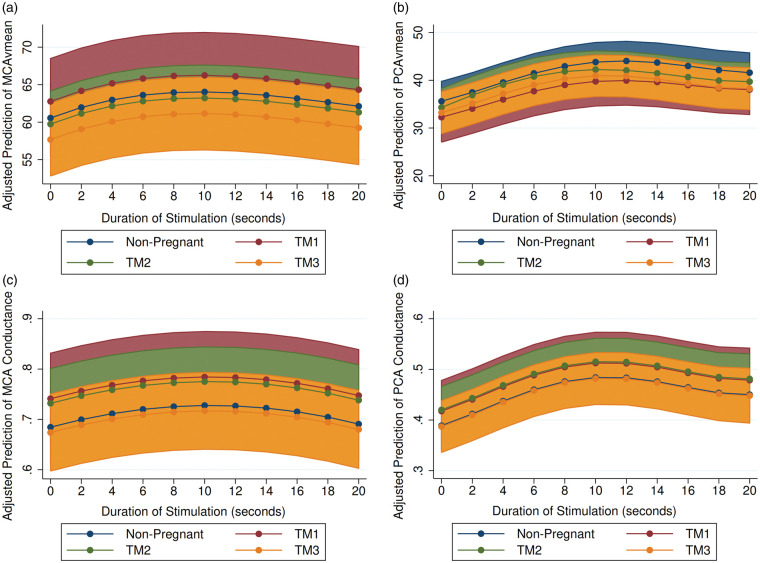
Figure 1.
The predicted response to NVC challenge in: (a) MCAvmean; (b) PCAvmean; (c) MCA conductance; and (d) PCA conductance over light stimulation duration in seconds. Light stimulation began at time 1 s and ceased at time 30 s. All models adjusted for within-participant variability. Shaded area represents 95% Confidence Interval. Blue – nonpregnant; red – TM1; green – TM2; yellow – TM3. BL: baseline; MCA: middle cerebral artery; PCA: posterior cerebral artery; TM1: trimester 1; TM2: trimester 2; TM3: trimester 3.

