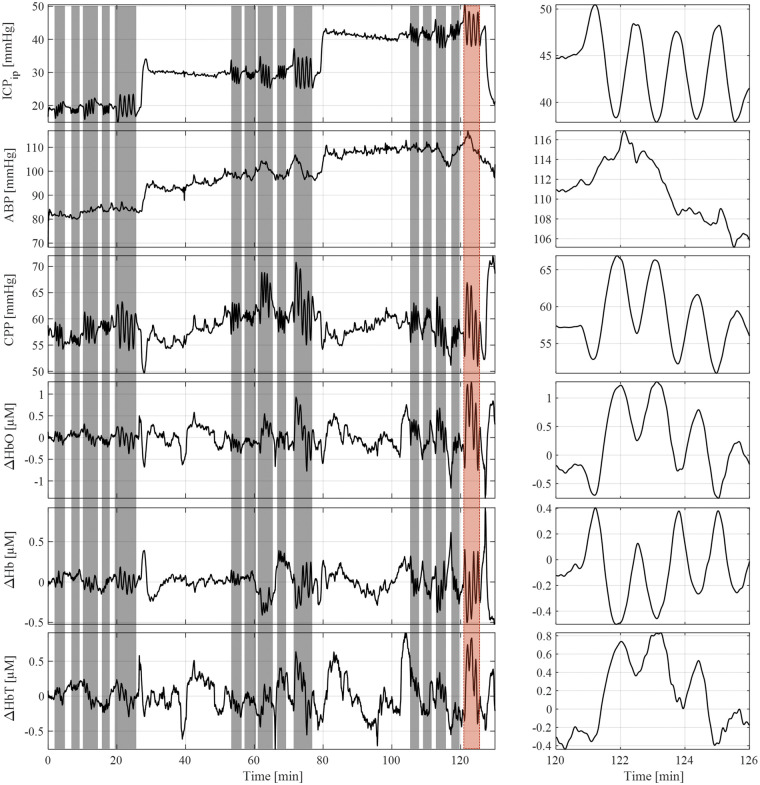
Figure 3.
This representative measurement shows parts of the protocol. The top graph illustrates the baseline changes in ICPip with sinosoidal induced oscillations highlighted in grey. A close up of the induced oscillation indicated by the red background is shown on the right. Oscillations in ICP did not translate into ABP oscillations, shown in the second graph from the top. CPP, ΔHbO, ΔHb, and ΔHbT showed oscillations corresponding to the ICPip change induced.

