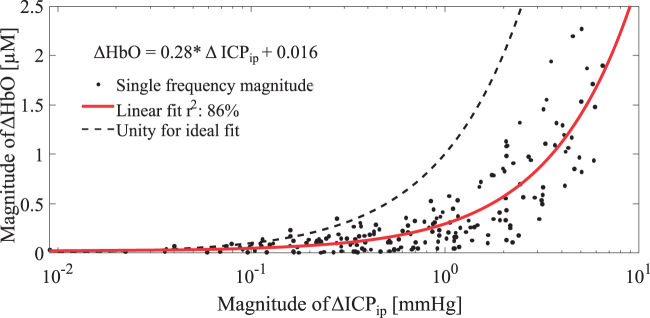
Figure 4.
Linear relationship between oscillation magnitudes in ΔHbO and invasively measured ΔICPip. The linear fit is shown as a function in the top left. Note that the x-axis is shown in logarithmic scale to improve visibility of low magnitude data points. A unity line is shown for reference to indicate an ideal fit.

