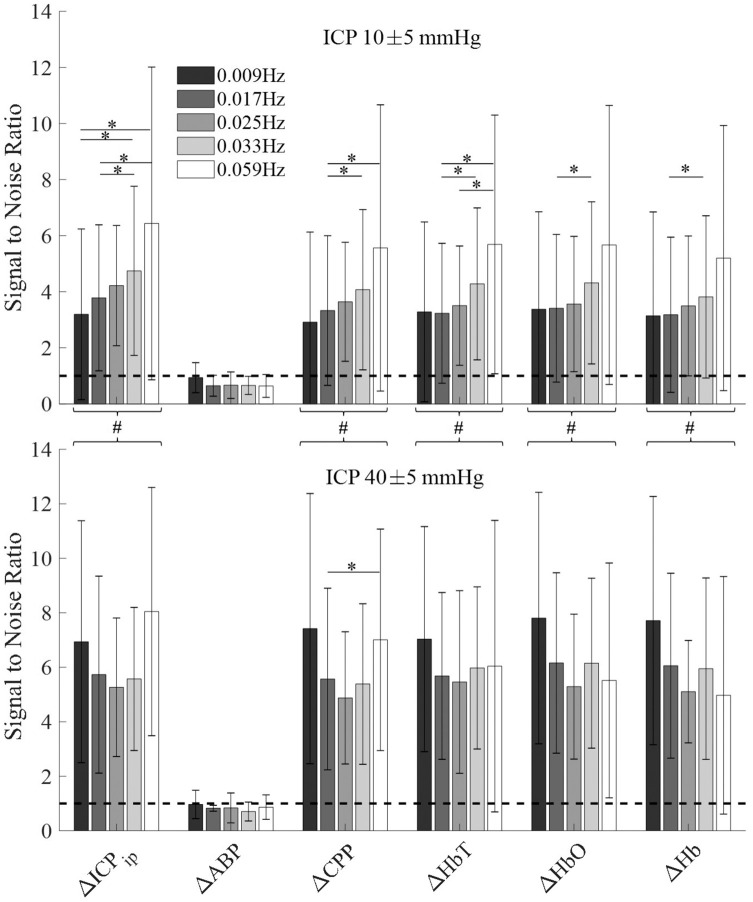
Figure 5.
The signal-to-noise ratio (SNR) was calculated as the ratio of frequency specific amplitudes. The amplitude during ICP oscillation is considered the signal, while amplitude of the same frequency without induced ICP oscillation is considered noise. The dashed line shows the noise level at SNR = 1. Error bars show the standard deviation at every given frequency. Top: Healthy baseline ICP. Bottom: Highly elevated baseline ICP. A single asterisk indicates significantly different (p < 0.05) average SNR calculated by a paired t-test across frequencies within one signal type. The pound sign indicates significantly higher SNR in high ICP baseline (p < 0.05) as indicated by two-sample t-test when treating all frequencies of a signal as one group.

