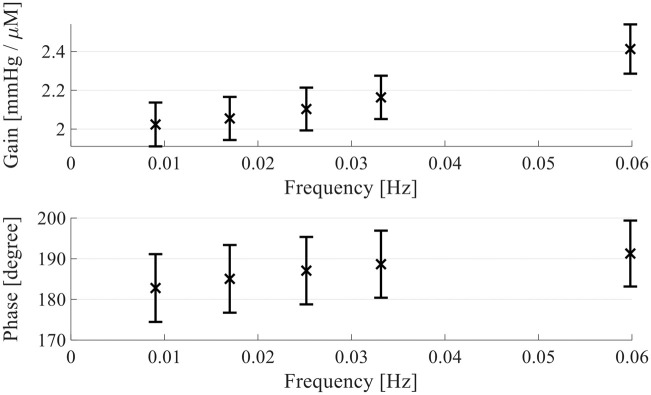
Figure 6.
Bode plot of the found transfer function. The error bars show the standard deviation over all subsets of the cross-validation algorithm used to fit the transfer functions. The mean of all coefficients of all transfer functions is calculated and its gain (top) and phase delay (bottom) from ΔHbO to ΔICPip is shown above.

