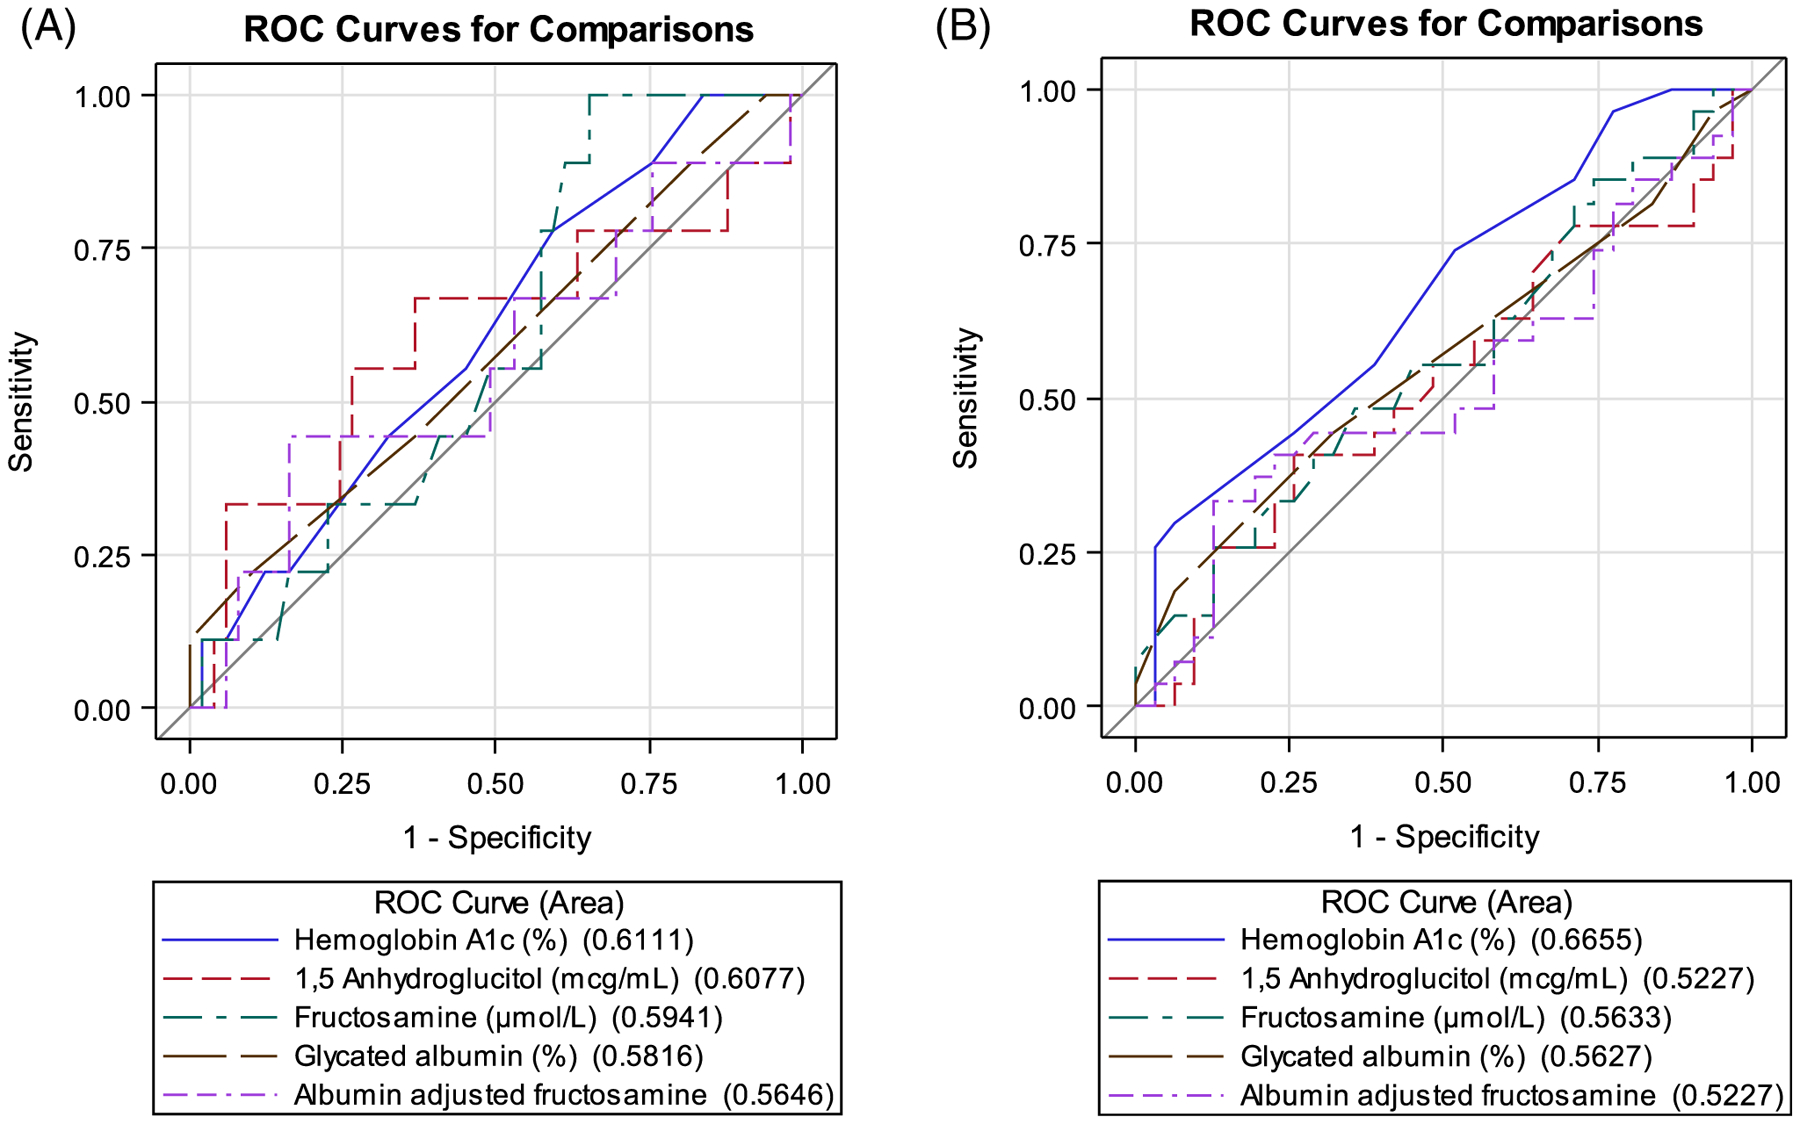
FIGURE 1.

(A) Oral glucose tolerance test 2-hour glucose ≥200 mg/dL. Area under the receiver operating characteristic (ROC-AUC) curve measurements for alternative glycemic markers at predicting cystic fibrosis-related diabetes. ROC-AUC values (95% CI): hemoglobin A1c 0.61 (0.42, 0.80), 1,5-anhydroglucitol 0.61 (0.37, 0.85), fructosamine 0.59 (0.42, 0.77), glycated albumin 0.58 (0.37, 0.79), and albumin-adjusted fructosamine 0.56 (0.33, 0.80). All associated p-values were non-significant. (B) Oral glucose tolerance test 2-hour glucose ≥140 mg/dL. Area under the receiver operating characteristic (ROC-AUC) curve measurements for alterative glycemic markers at predicting cystic fibrosis-related pre-diabetes. ROC-AUC values (95% CI): hemoglobin A1c 0.67 (0.53, 0.8), 1,5-anhydroglucitol 0.52 (0.37, 0.68), fructosamine 0.56 (0.41, 0.71), glycated albumin 0.56 (0.42, 0.71), and albumin-adjusted fructosamine 0.52 (0.37, 0.69). All associated p-values were non-significant
