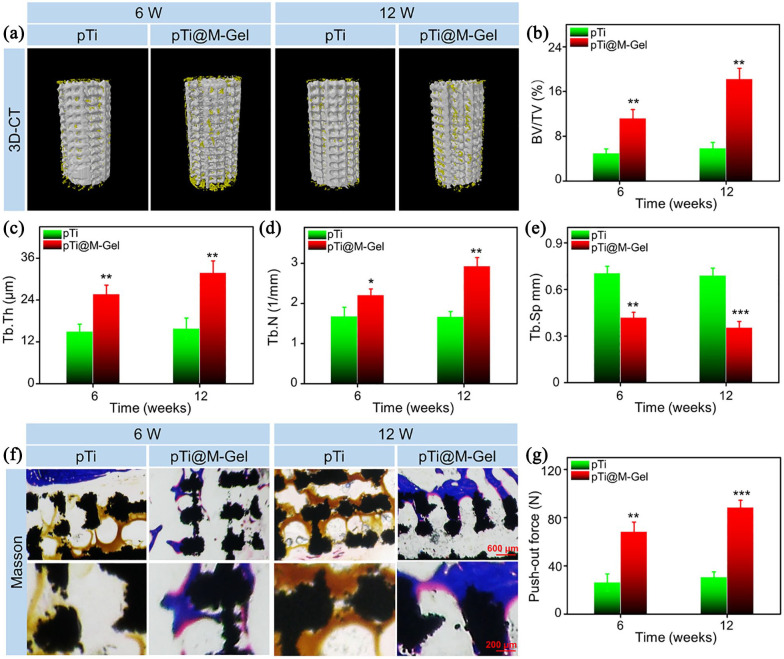
Figure 8.
(a) 3D reconstruction images of porous implants (white) and regenerated bone tissue (yellow). Quantitative analysis of (b) BV/TV, (C) Tb.Th, (D) Tb.N, and (e) Tb.Sp of pTi and pTi@M-Gel groups according to Micro-CT at 6 and 12 weeks post-implantation. (f) Representative histological images Masson staining (The black areas indicated the pTi scaffolds, the blue areas indicated the bone, and the yellow areas was pus). (g) Evaluation of osseointegration through pull-out biomechanical testing after implantation for 6 and12 weeks (*p < 0.05, **p < 0.01, ***p < 0.001 compared with the pTi group).

