Figure 1.
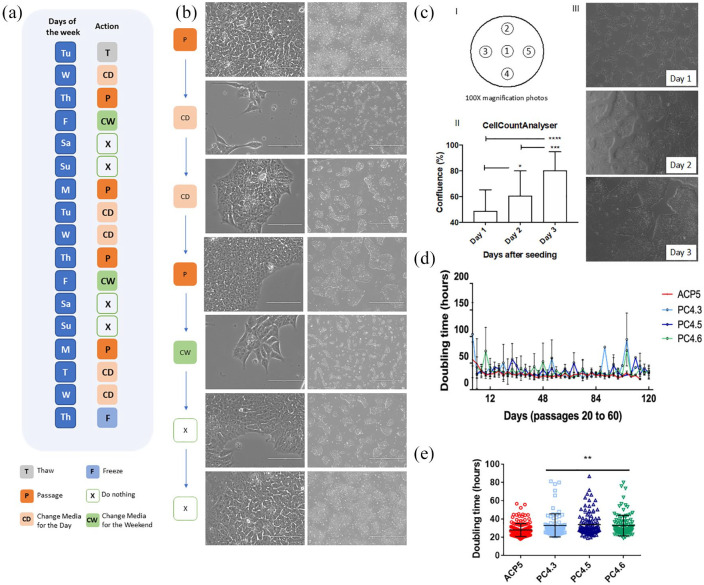
Single-cell passaging did not impair hiPSC morphology or colony formation capacity. (a) Scheme of the hiPSC maintenance workflow for the week. (b) Cell morphology throughout the days before media changing. Right scale bar represents 1000 µM and the left scale bar represents 100 µM. (c) Cell confluence was monitored by CellCounterAnalyser. (I) Representative scheme of the five recorded photos per 6-well plates, (II) quantification of five different passages recorded 3 days after seeding, data presented as mean ± SD. *p < 0.05; ***p < 0.001 and ****p < 0.0001 by analysis of variance (ANOVA), (III) representative images of the photos recorded for quantification. (d) PDT of hiPSC clones ACP5 (n = 8), PC4.3 (n = 5), PC4.5 (n = 4) and PC4.6 (n = 5) from passage 20 to 60. (e) All PDT values obtained for clones ACP5 (n = 165), PC4.3 (n = 83), PC4.5 (n = 100), PC4.6 (n = 112). Data is presented as mean ± SD. **p < 0.01 versus ACP5 by ANOVA.

