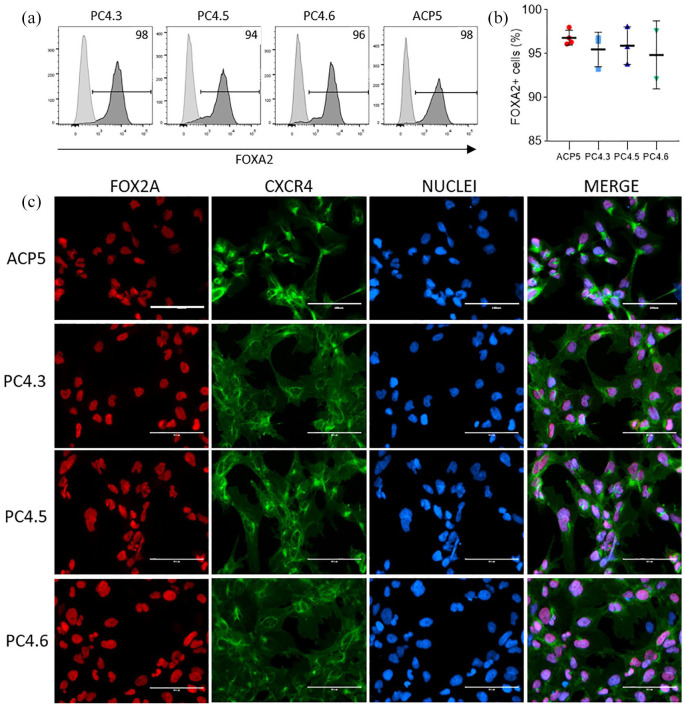
Figure 6.
Directed differentiation into DE using hiPSC. (a) and (b) FC data showing expression of FOXA2 marker in DE obtained from hiPSC clones PC4.3, PC4.5, PC4.6 and ACP5. Light and dark gray curves indicate negative control (hiPSC) and positive cells (hiPSC-DE), respectively. Data is presented as mean ± SD, n = 2–4. One-way ANOVA p = 0.7; (c) representative immunostaining of DE markers for all clones double-stained with FOXA2 and CXCR4. Nuclei was stained with Hoechst 3342.

