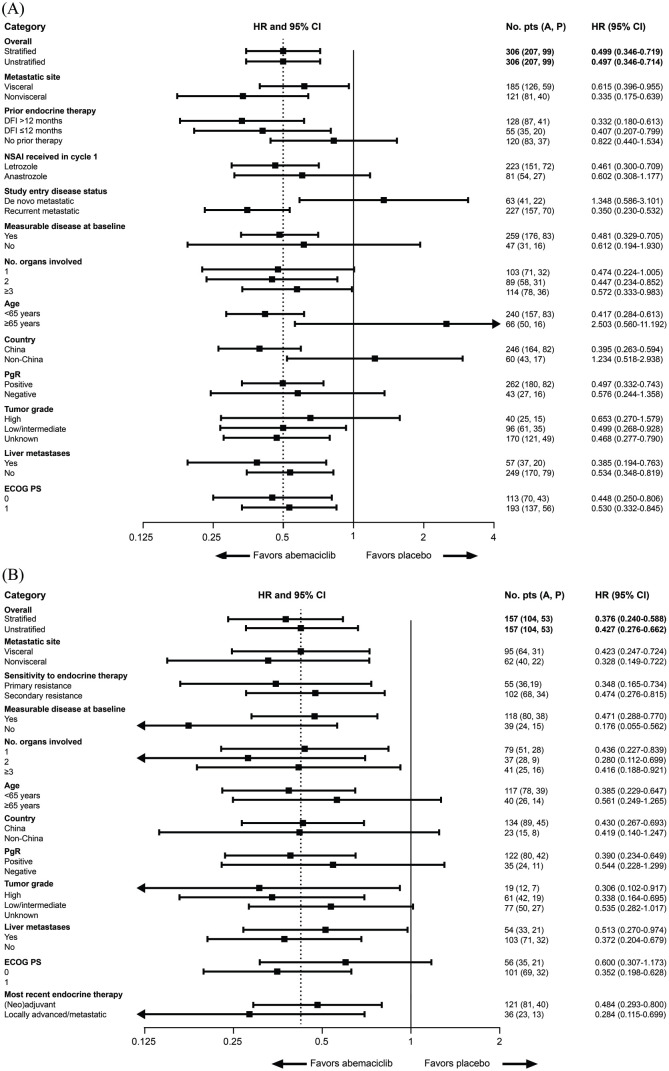
Figure 3.
Progression-free survival subgroup analyses in the ITT population in (A) cohort A and (B) cohort B.Progression-free survival hazard ratios are indicated by squares and 95% CIs are indicated by the crossing horizontal lines. Hazard ratios are unstratified and estimated with the adjustment of treatment arm by subgroup interaction, with the exception of the PFS hazard ratio for the overall study population, which is also presented as the stratified hazard ratio. Groups with <10% of randomly assigned patients were omitted [patients with locoregionally recurrent disease (n = 15) in the ‘study entry disease status’ category (panel A)]. In panel A, the error bar for the subgroup of patients aged ⩾65 years is clipped at the upper limit. In panel B, the error bars for the subgroups of patients with no measurable disease at baseline, two organs involved in metastasis, high tumor grade, and most recent endocrine therapy in the locally advanced/metastatic setting are clipped at the lower limit. A, abemaciclib; AI, aromatase inhibitor; CI, confidence interval; DFI, disease-free interval; ECOG, Eastern Cooperative Oncology Group; HR, hazard ratio; ITT, intent-to-treat; NSAI, non-steroidal aromatase inhibitor; P, placebo; PgR, progesterone receptor; PS, performance status.

