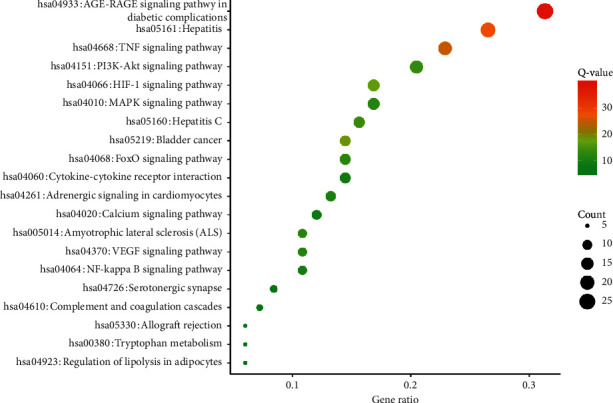
Figure 6.

KEGG pathway enrichment analyses of potential targets of the main active ingredients of WXKL. Node colors are shown as a gradient from red to green according to the descending order of P values. Node sizes are in the ascending order of the gene count.
