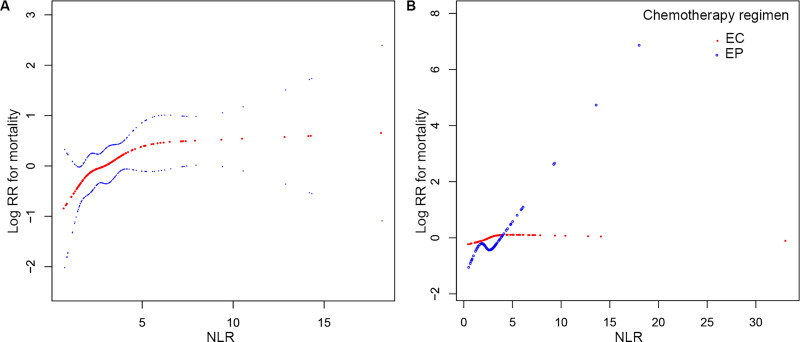
Figure 1.
Smooth curve fitting for the relationship between baseline NLR and log (RR) for risk of mortality in SCLC patients. Red dotted lines represent the spline plots of log (RR) for mortality, and blue dotted lines represent the 95% CIs of the spline plots. (A) The relationship between NLR and log (RR) for mortality. Adjusted for sex, tumor stage, smoking status, number of metastatic sites, ALB, BMI, CRP, and LDH. (B) The relationship between NLR and log (RR) for mortality stratified by first-line chemotherapy regimen without adjustment.

