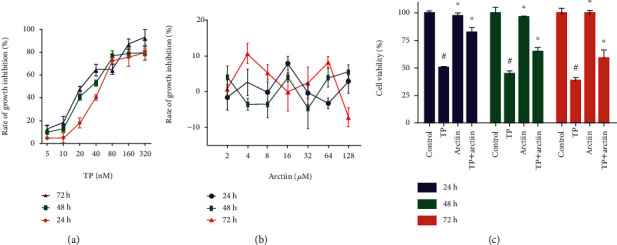
Figure 1.

Cytotoxity of TP, arctiin, and TP + arctiin in HepG2 cells. (a) HepG2 cells were treated with triptolide (TP) at various concentrations for 24, 48, and 72 h. (b) HepG2 cells were treated with arctiin at various concentrations for 24, 48, and 72 h. (c) Cells were exposed to TP, arctiin, and TP + arctiin, and cell growth inhibition rates were measured by MTT assay. The growth inhibition rate of the cells was expressed as %. All data are represented as the mean ± SD (n = 6). #P < 0.05 compared to the control group; ∗P < 0.05 compared to the TP-treated group.
