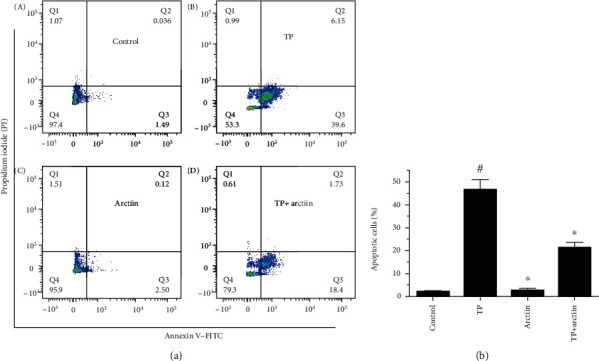
Figure 3.

Effects of TP, arctiin, and TP + arctiin on HepG2 cell apoptosis. HepG2 cells were treated with TP, arctiin, and TP + arctiin for 24 h, and cell apoptosis was determined by flow cytometry using Annexin V-FITC/PI double staining kits. The cell populations shown in (D) represents early apoptosis, while (B) represents late apoptosis and (A) represents necrotic cells. Histograms represent apoptosis rate (%). #P < 0.05 compared to the control group; ∗P < 0.05 compared to the TP-treated group.
