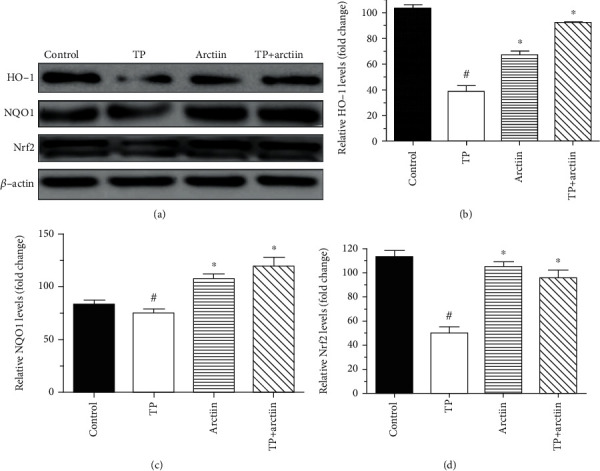
Figure 4.

Effects of TP and arctiin on Nrf2 pathway in HepG2 cells. HepG2 cells were treated with TP, arctiin, and TP + arctiin for 24 h, and the expression levels of Nrf2, HO-1, and NQO1 protein were determined by western blot analysis. (a) Panel shows representative bands of HO-1, NQO1, and Nrf2. Histograms represent optical density values of (b) HO-1, (c) NQO1, and (d) Nrf2 normalized to the corresponding β-actin. Data were presented as mean ± SD (n = 3). #P < 0.05 compared with the control group; ∗P < 0.05 compared with the TP group.
